OSWorld-Science A Benchmark of Computer Use Agents for Learning and Using Scientific Software

Dingyuan Dai2,* Heli Qi3,* Lei Liu6,* Yinxi Li4,* Baiding Chen5,* Zijun Dou1,*
Qingcheng Zeng7 Qi Kang8 Oliver Sun9 Eric Wang9 Bo Zhou10 Haixin Wang2 Yufan Du2 Shi Bo11 Ruihan Lin4 Mengqi Yuan12 Dunjie Lu12 Steven Dillmann13 Yiming Shi6 Tina Su6 Amy Xin1 Minghao Liu16 Xi Wang14 Xu Huang9
Ge Zhang15,† Pengyu Nie4,† Zhen Yang1,† Jie Tang1,† Juanzi Li1,† Weihao Xuan16,3,15,† Tianyu Liu1,6,*,†
1Tsinghua University 2University of California, Los Angeles 3RIKEN AIP 4University of Waterloo 5Carnegie Mellon University 6Yale University 7Northwestern University 8Zhejiang University 9University of California, Berkeley 10University of Illinois Chicago 11Boston University 12The University of Hong Kong 13Stanford University 14New York University 15TokenWave.AI 16The University of Tokyo

*Equal contribution (co-first authors).   †Corresponding authors.

Logos of the contributing institutions: DiscoAILab, Tsinghua University, UCLA, RIKEN AIP, Yale University, University of Waterloo, Carnegie Mellon University, Northwestern University, Zhejiang University, UC Berkeley, University of Illinois Chicago, Boston University, The University of Hong Kong, Stanford University, New York University, The University of Tokyo
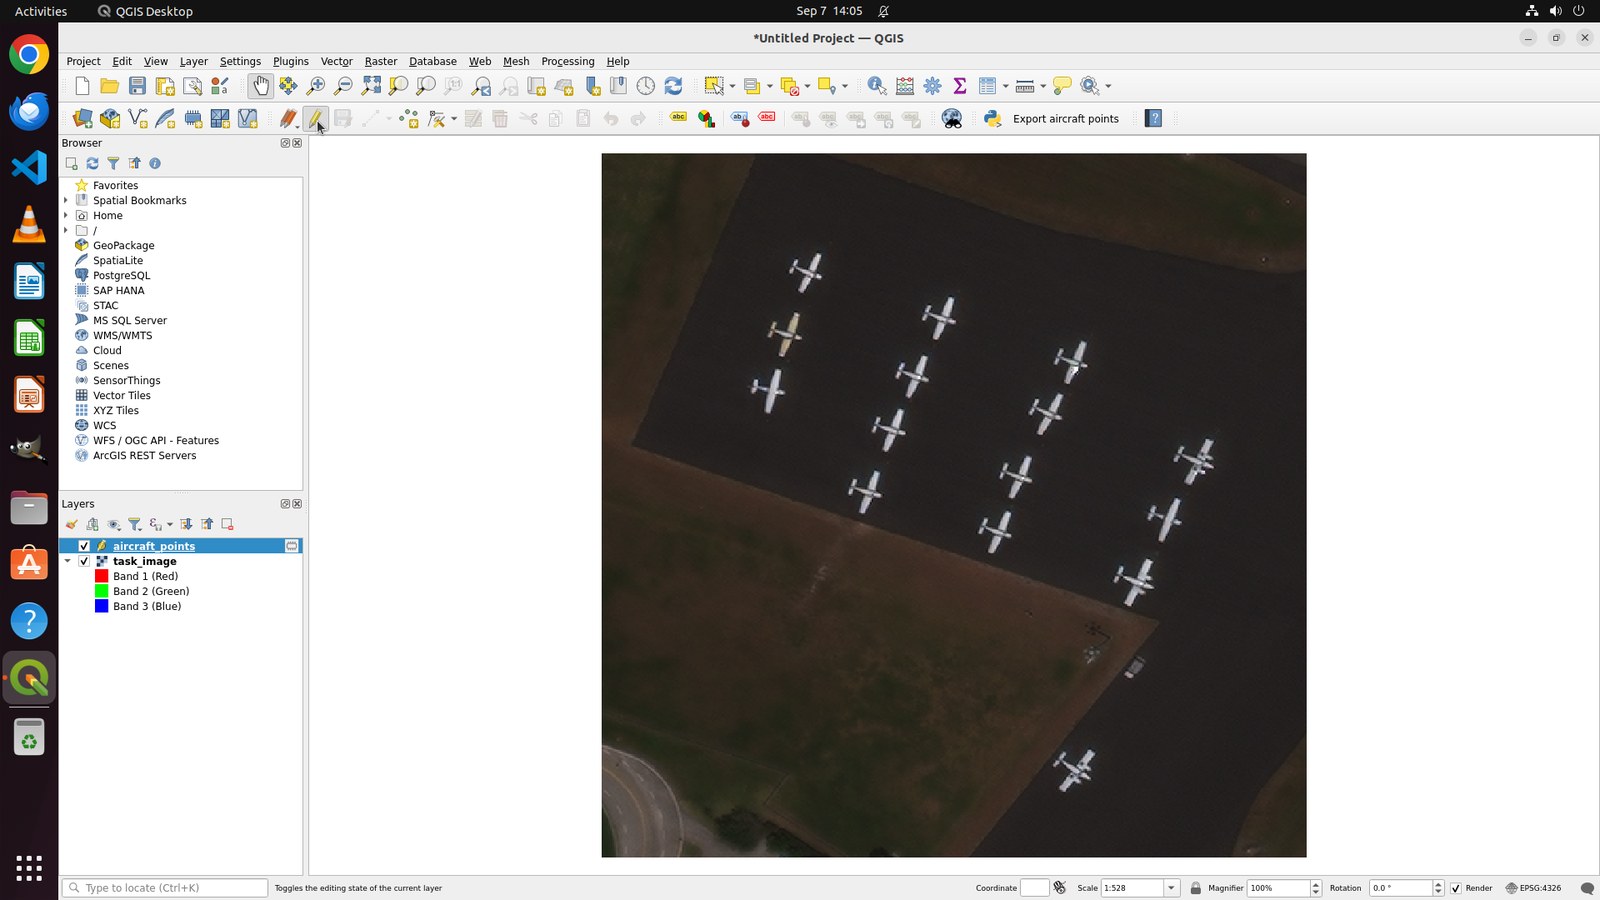
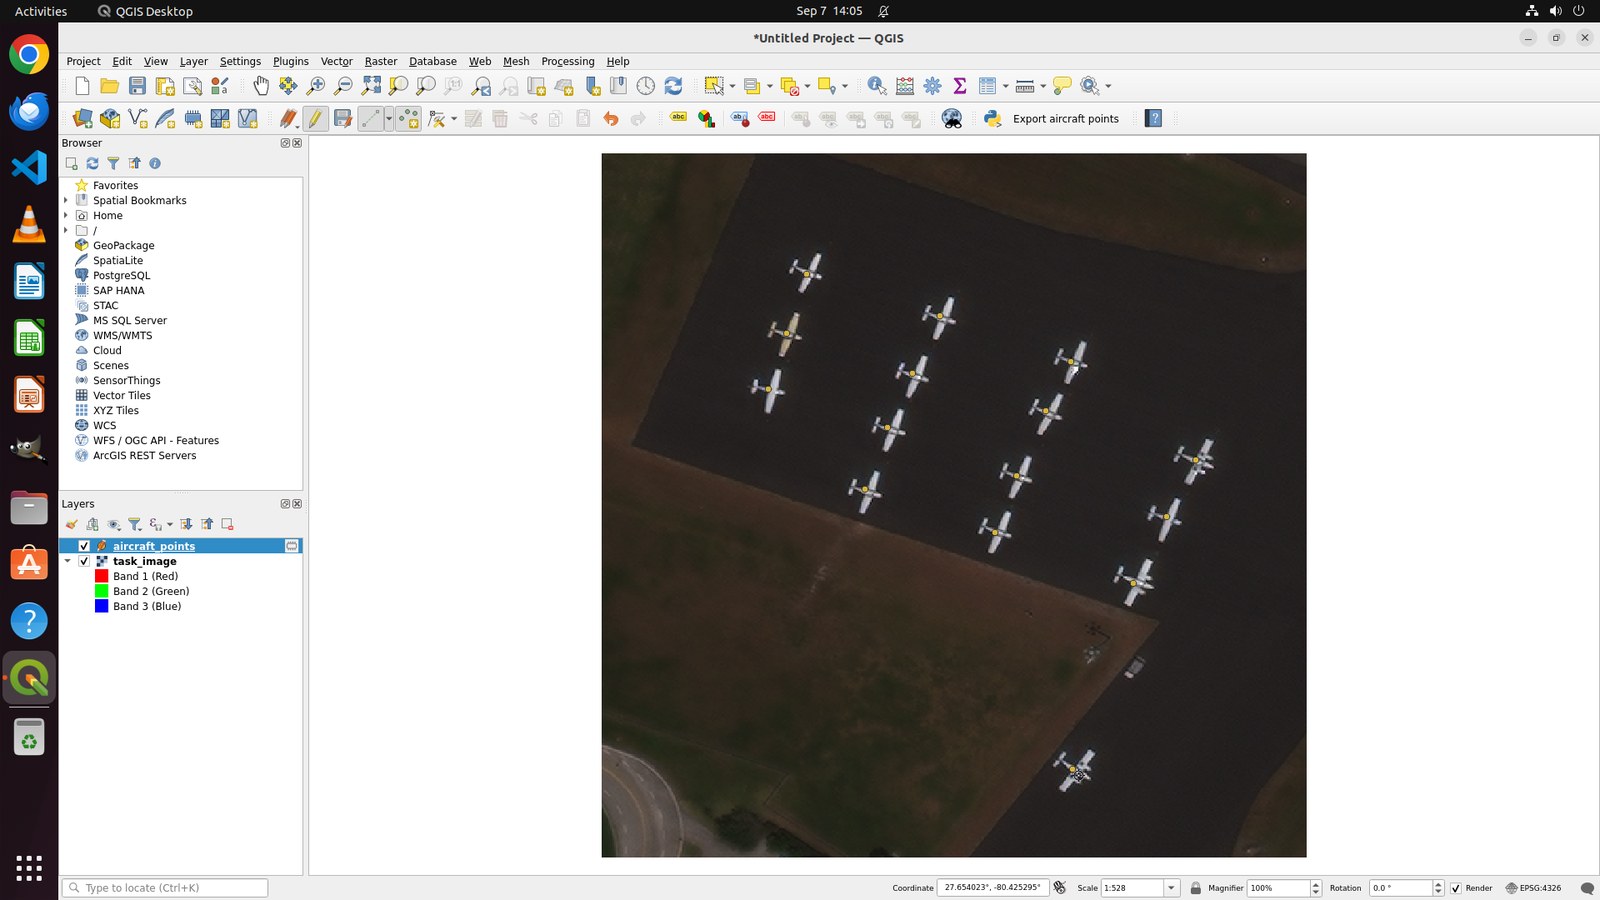
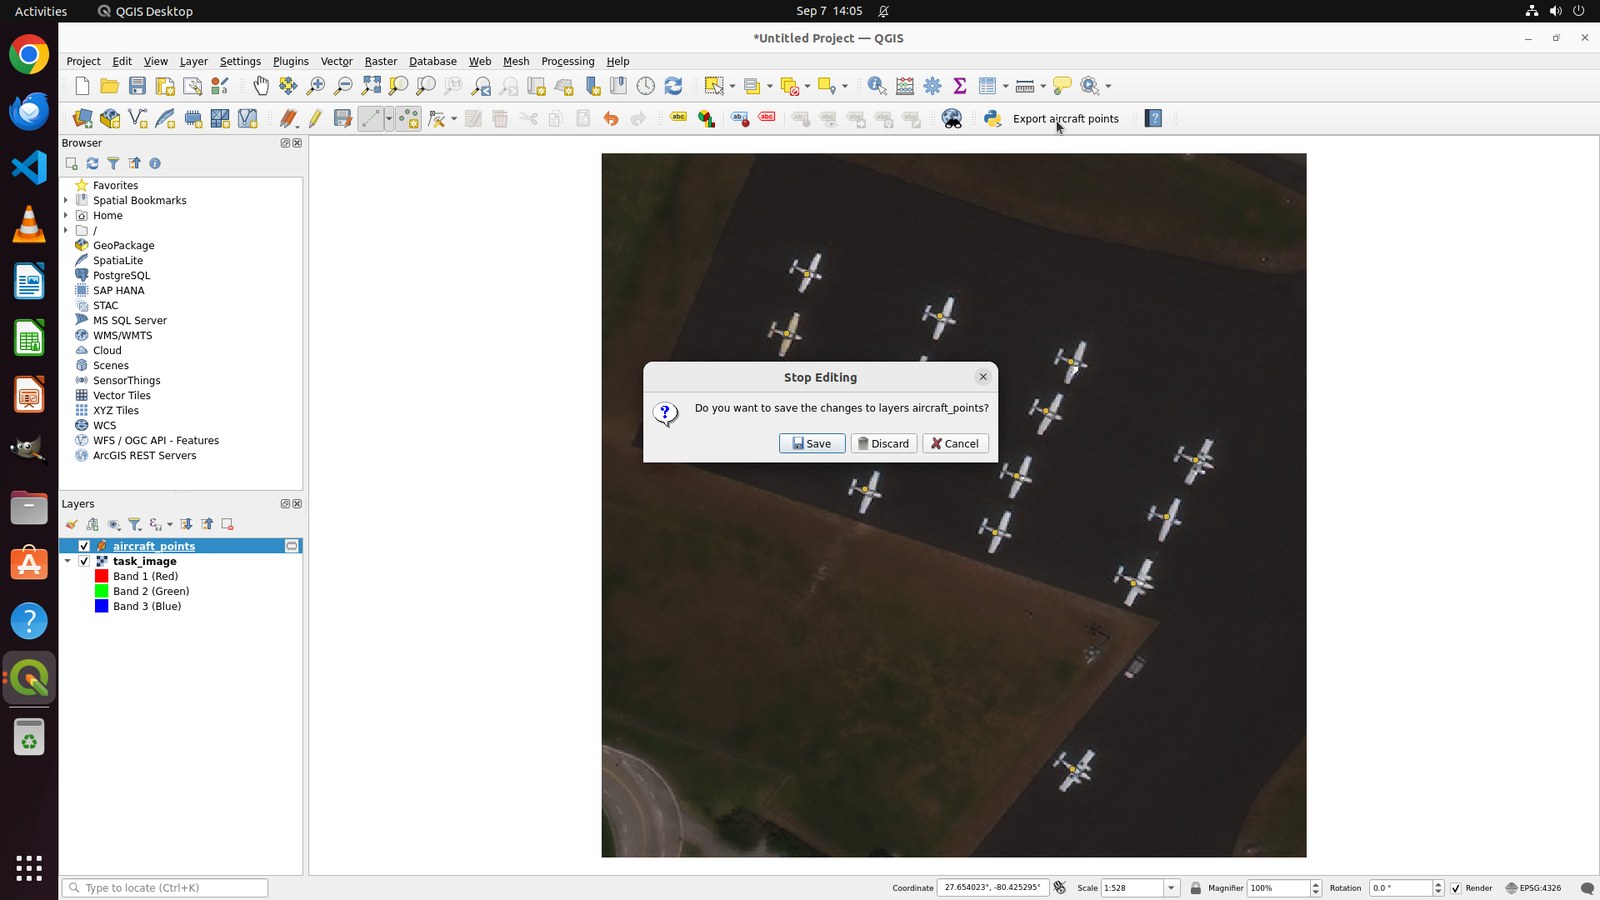
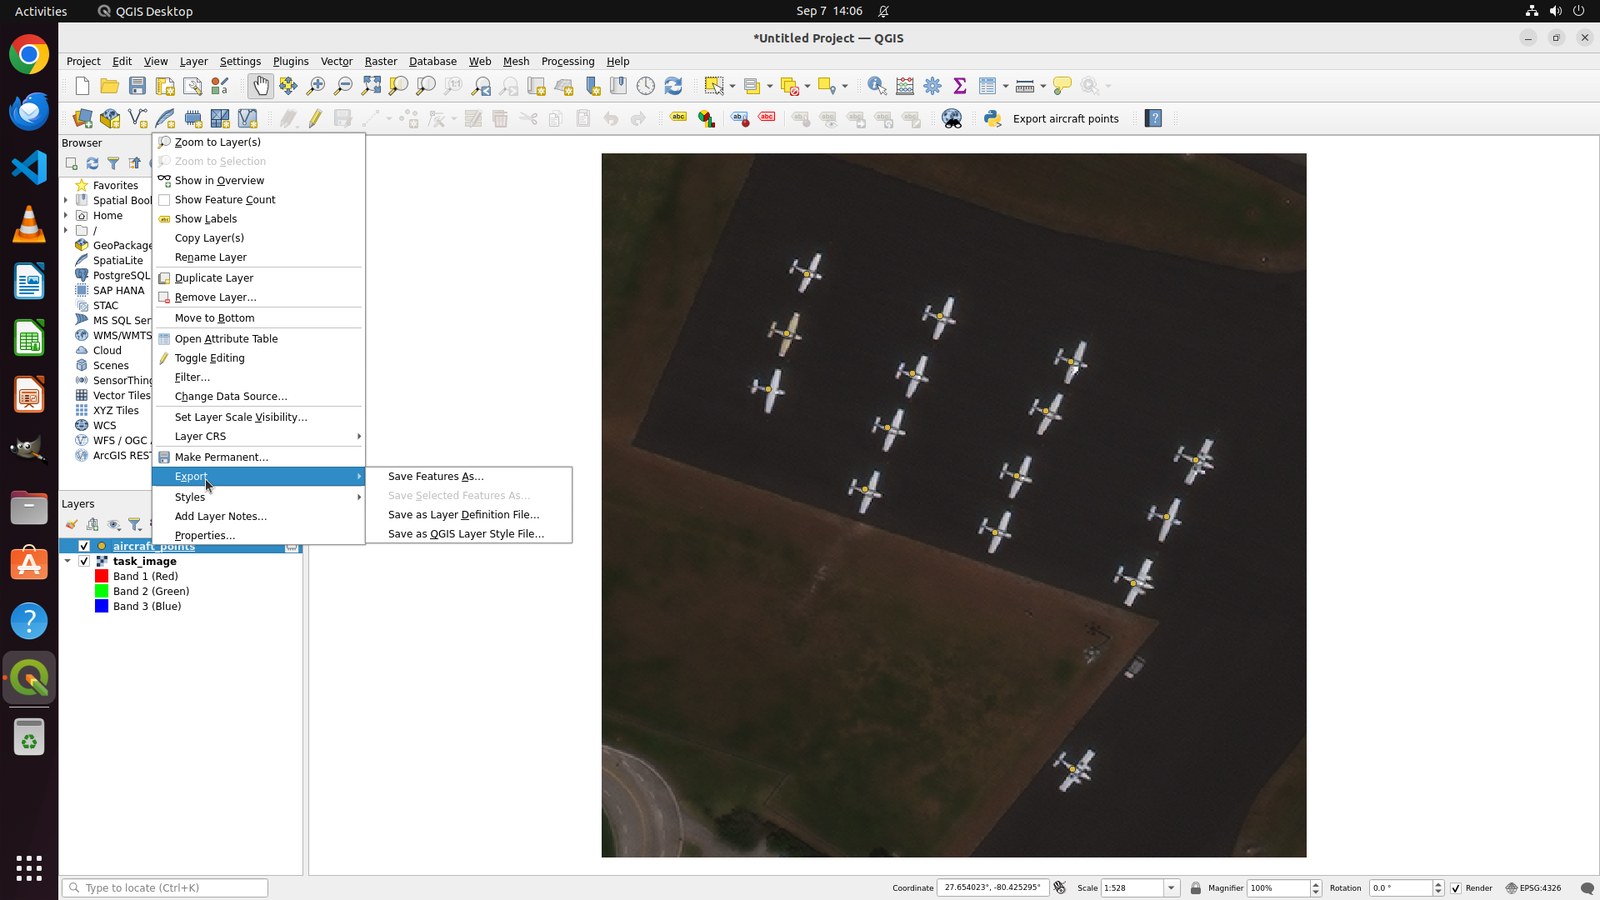
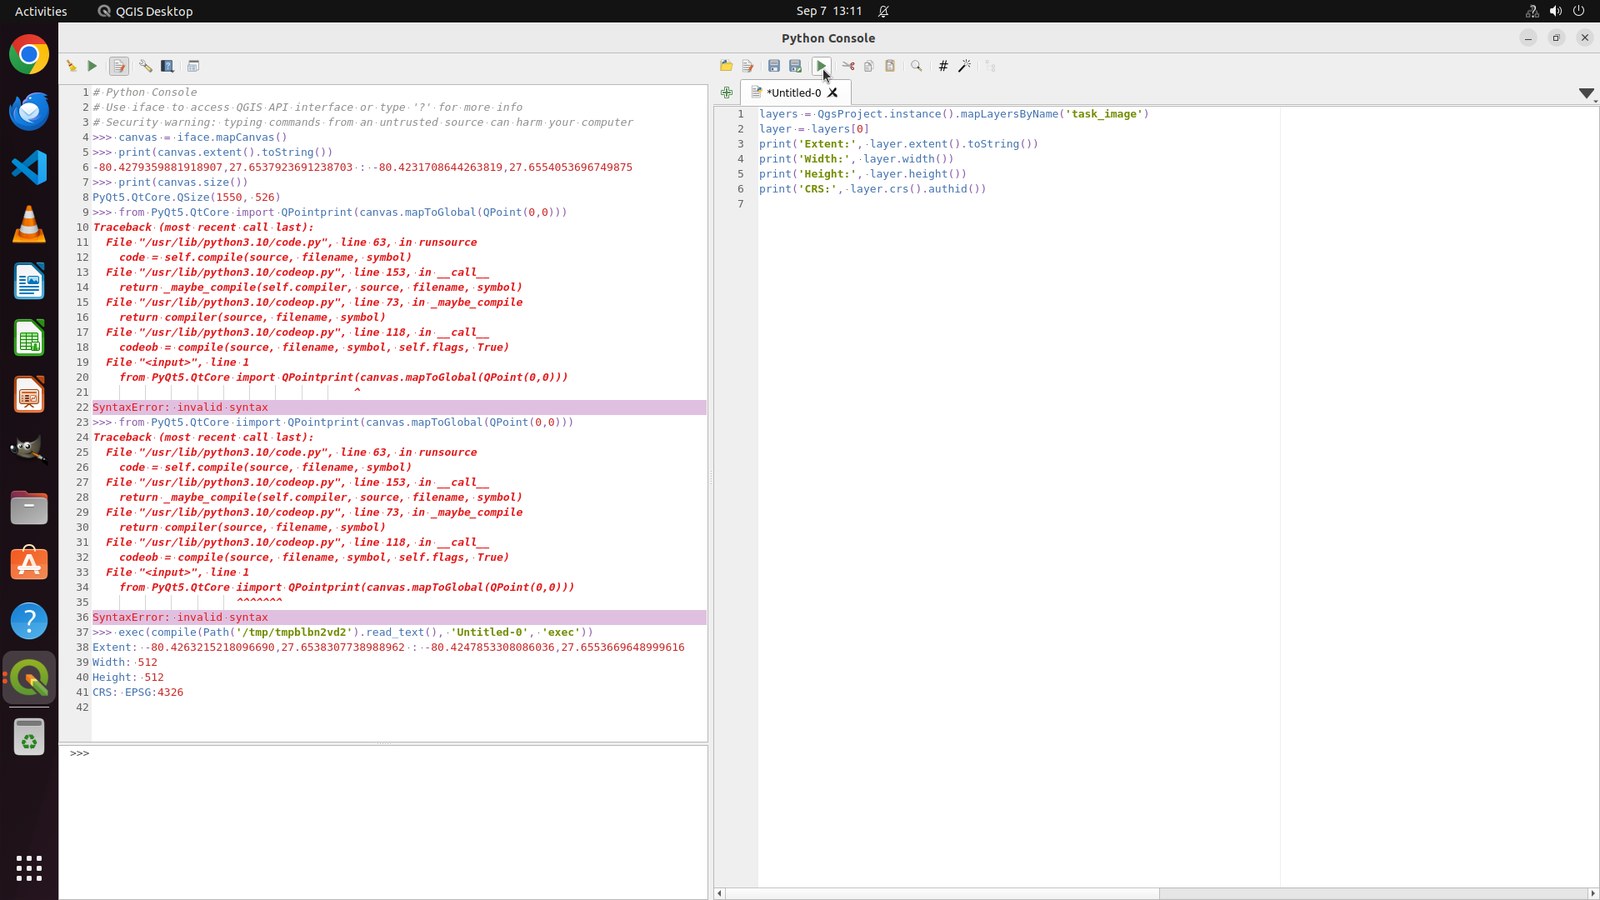
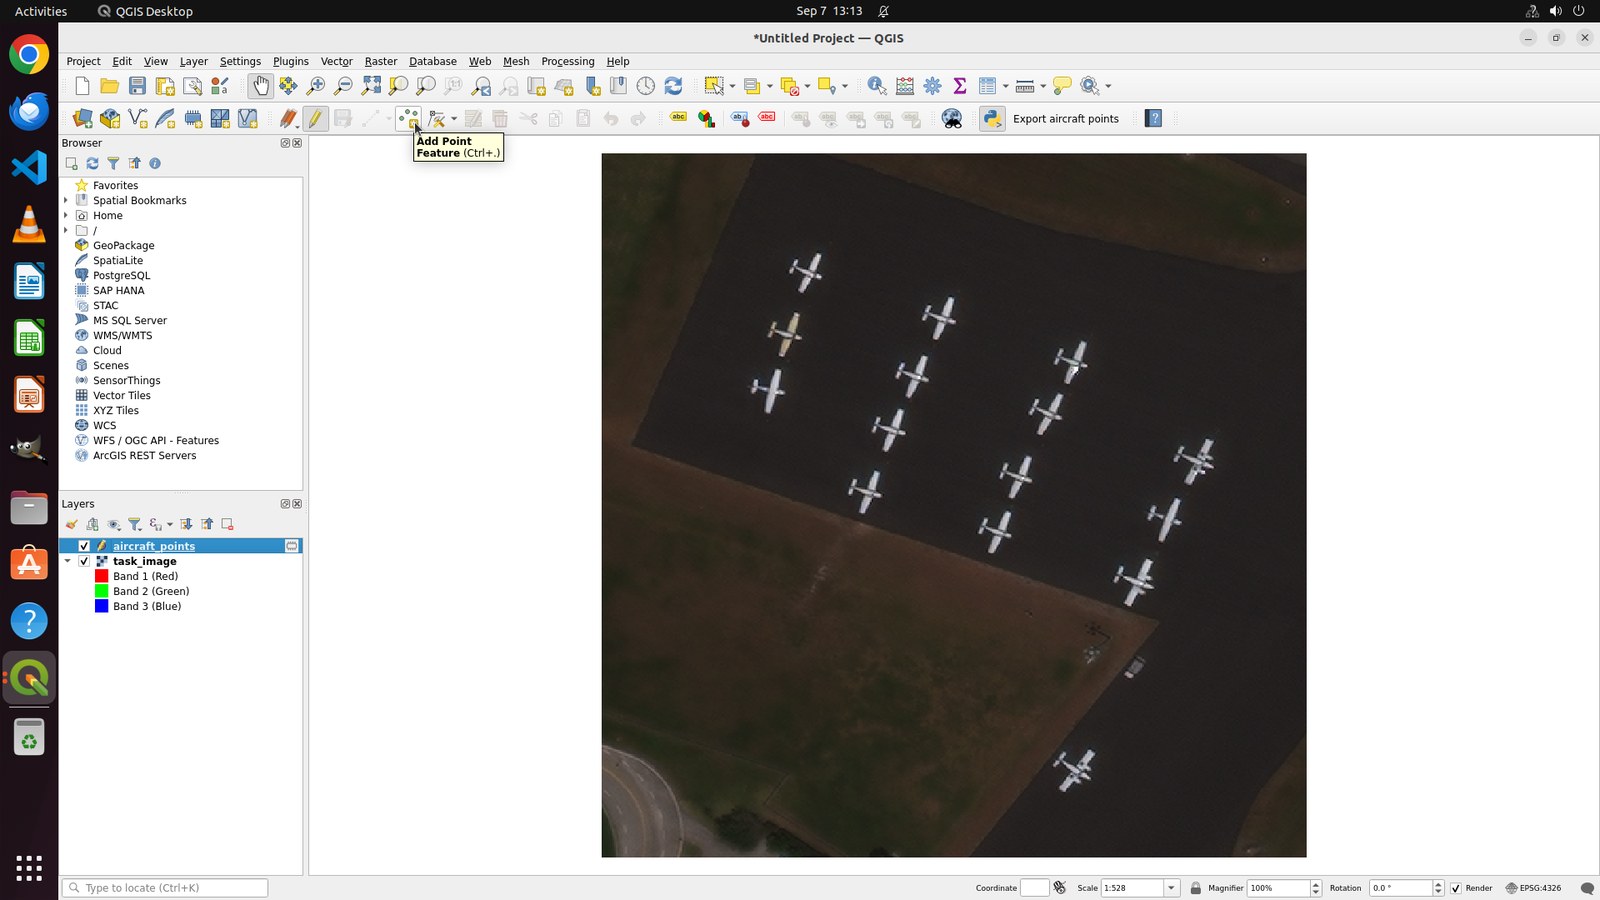
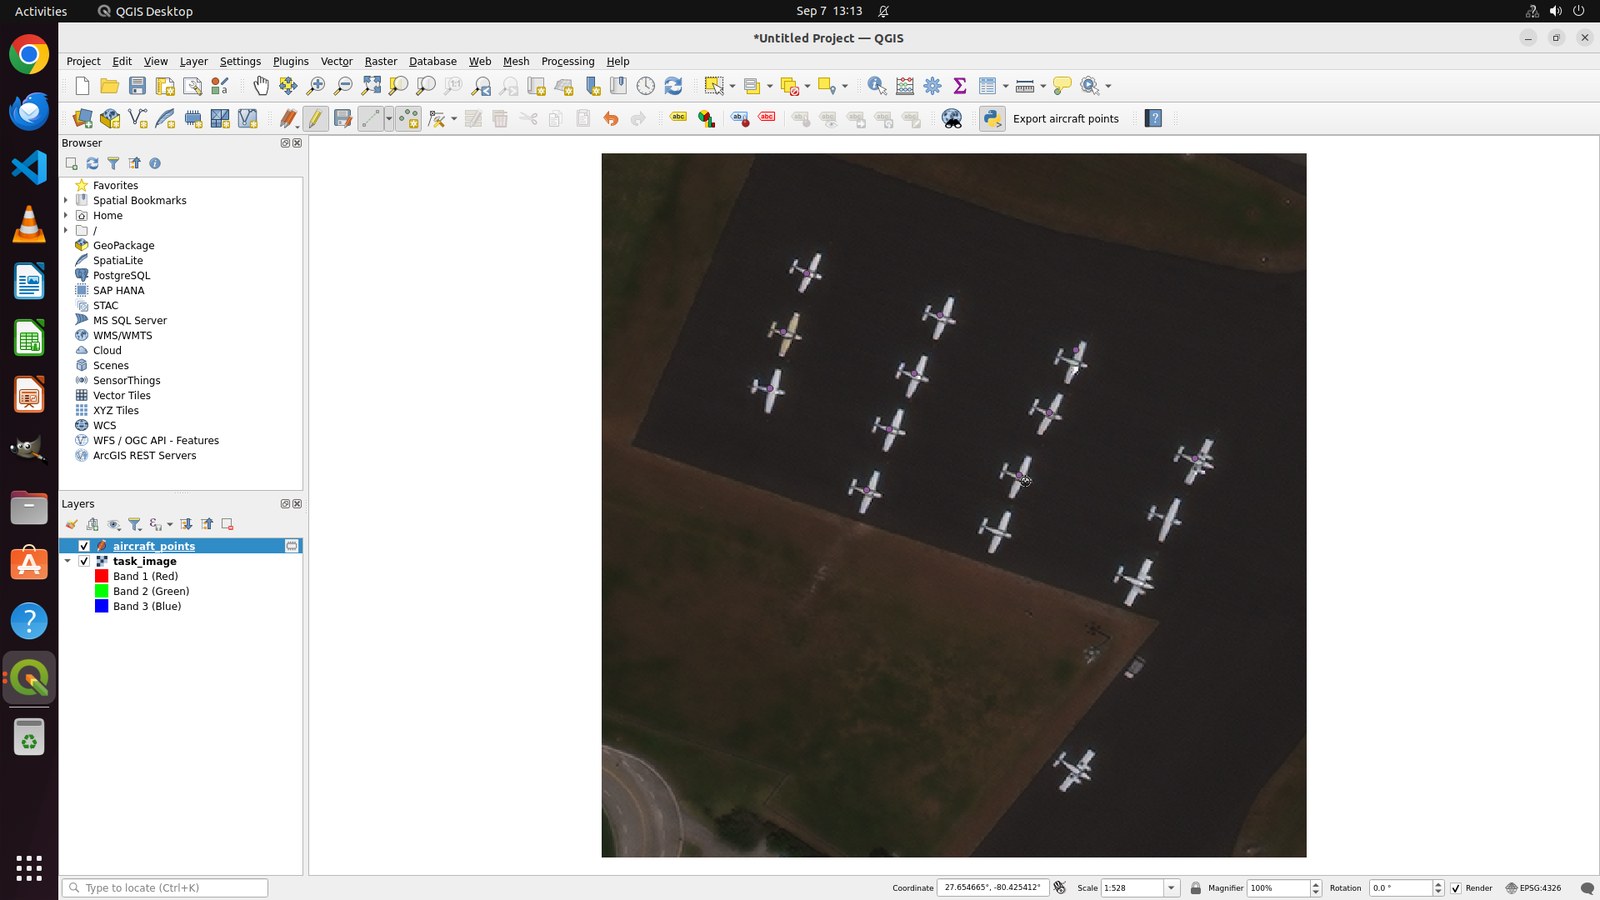
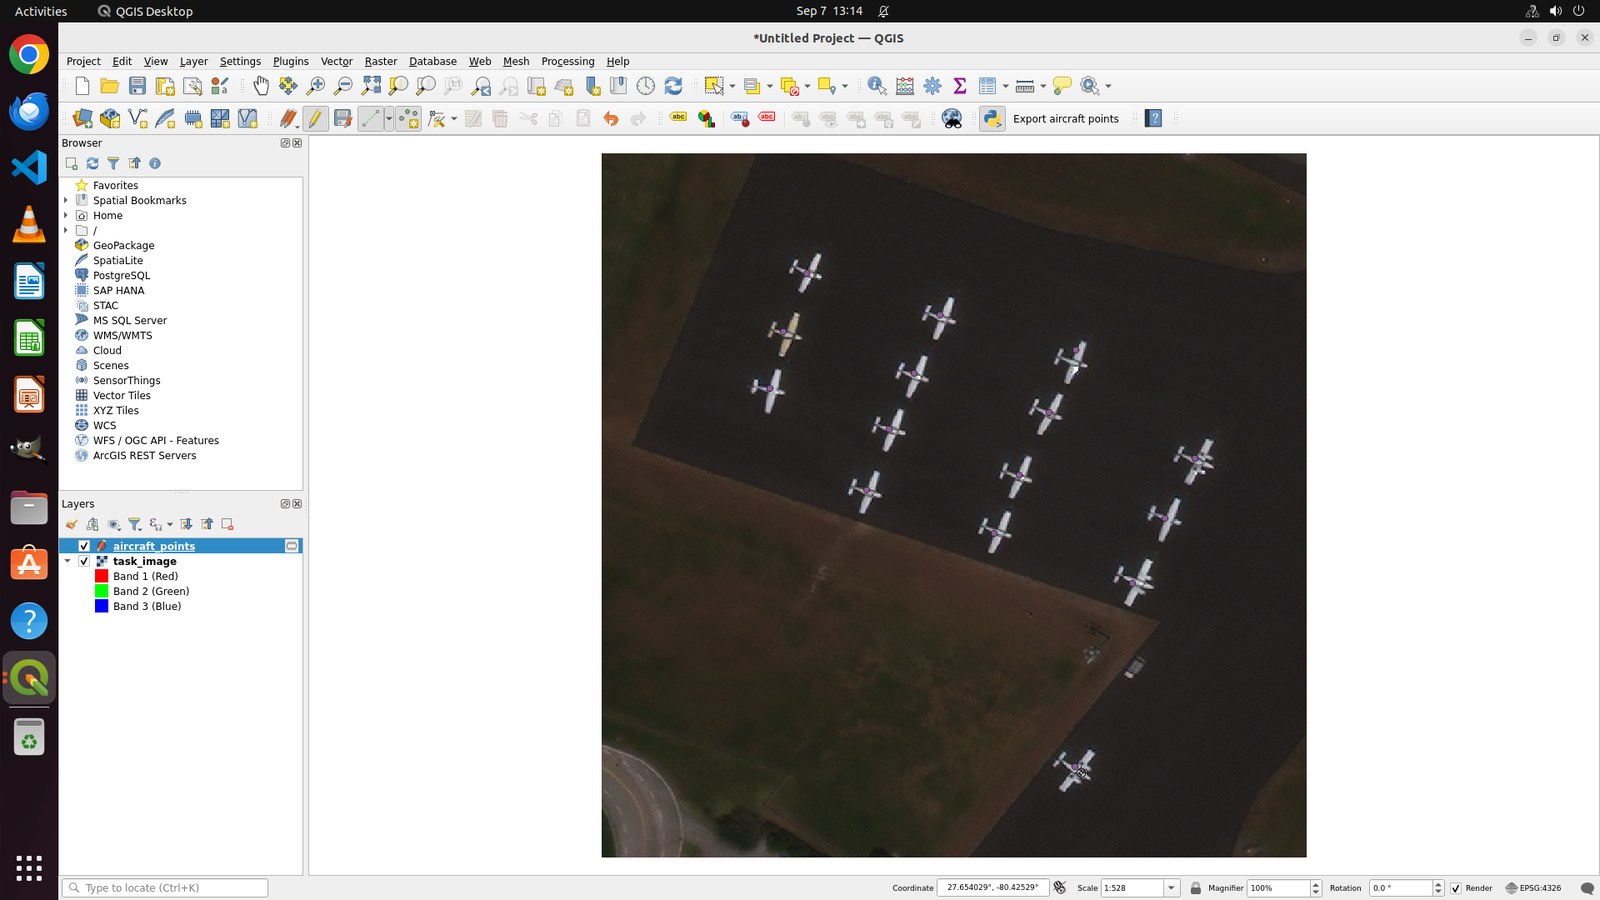
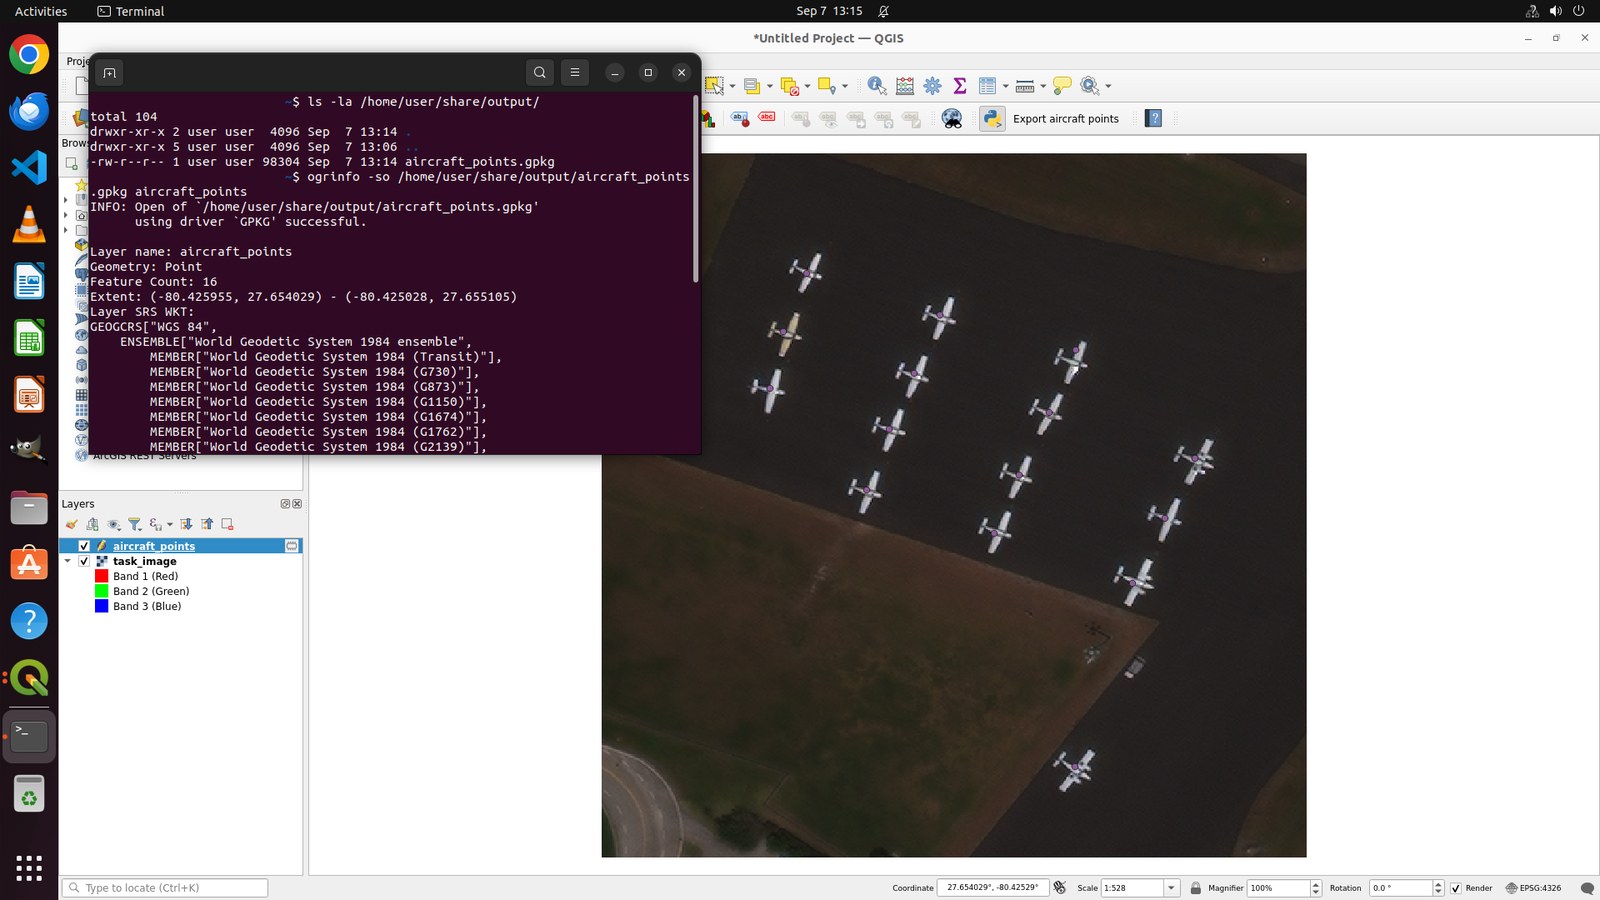
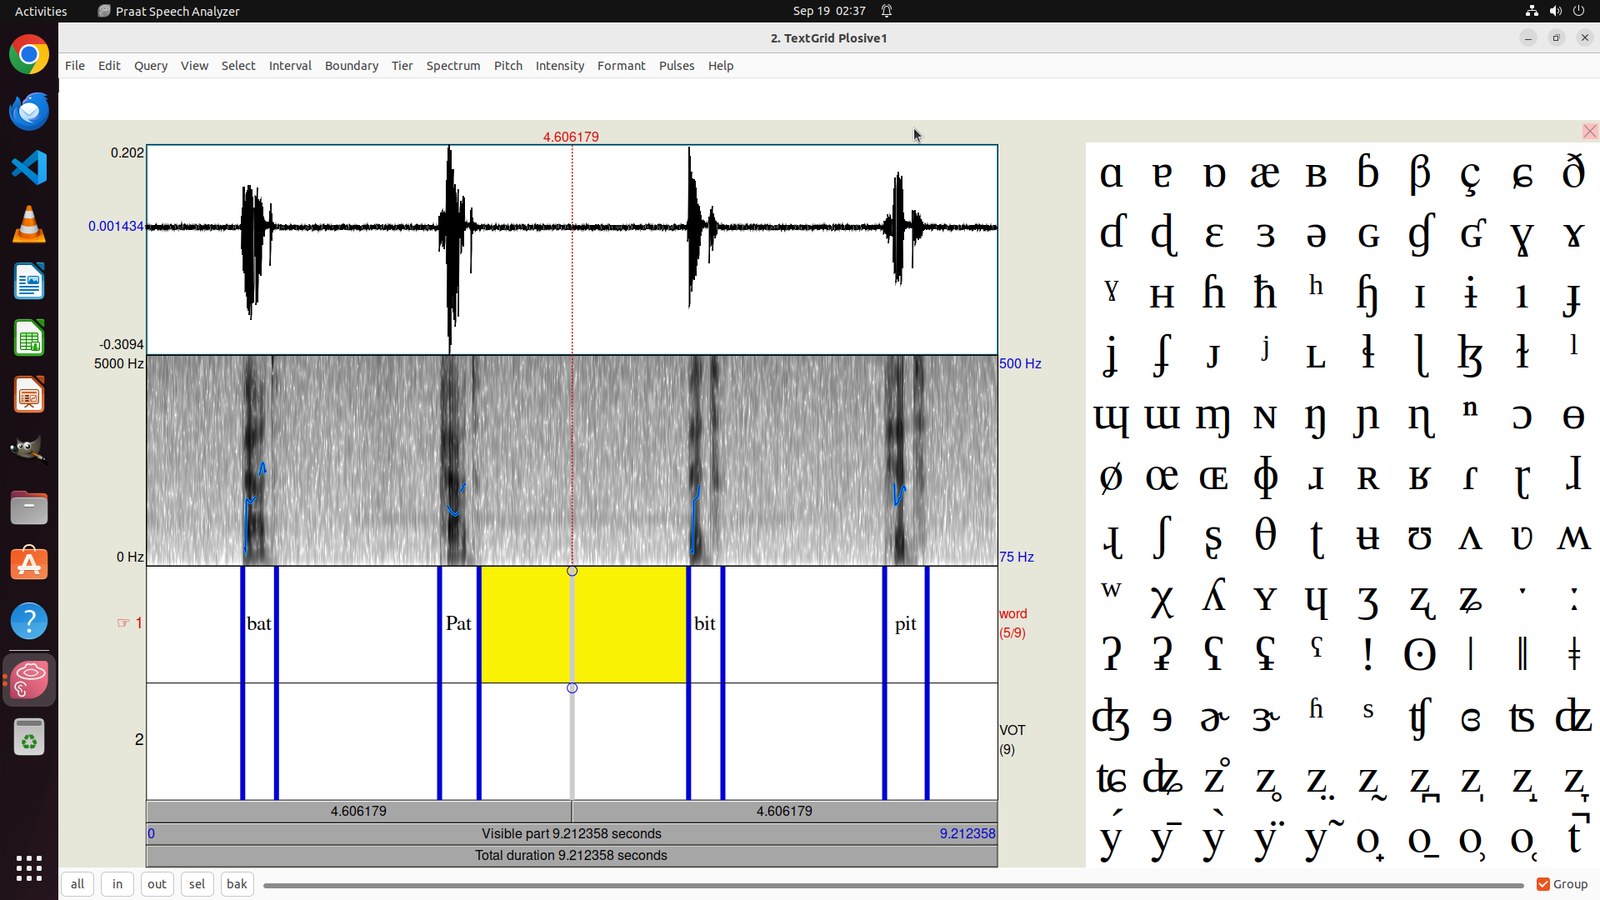
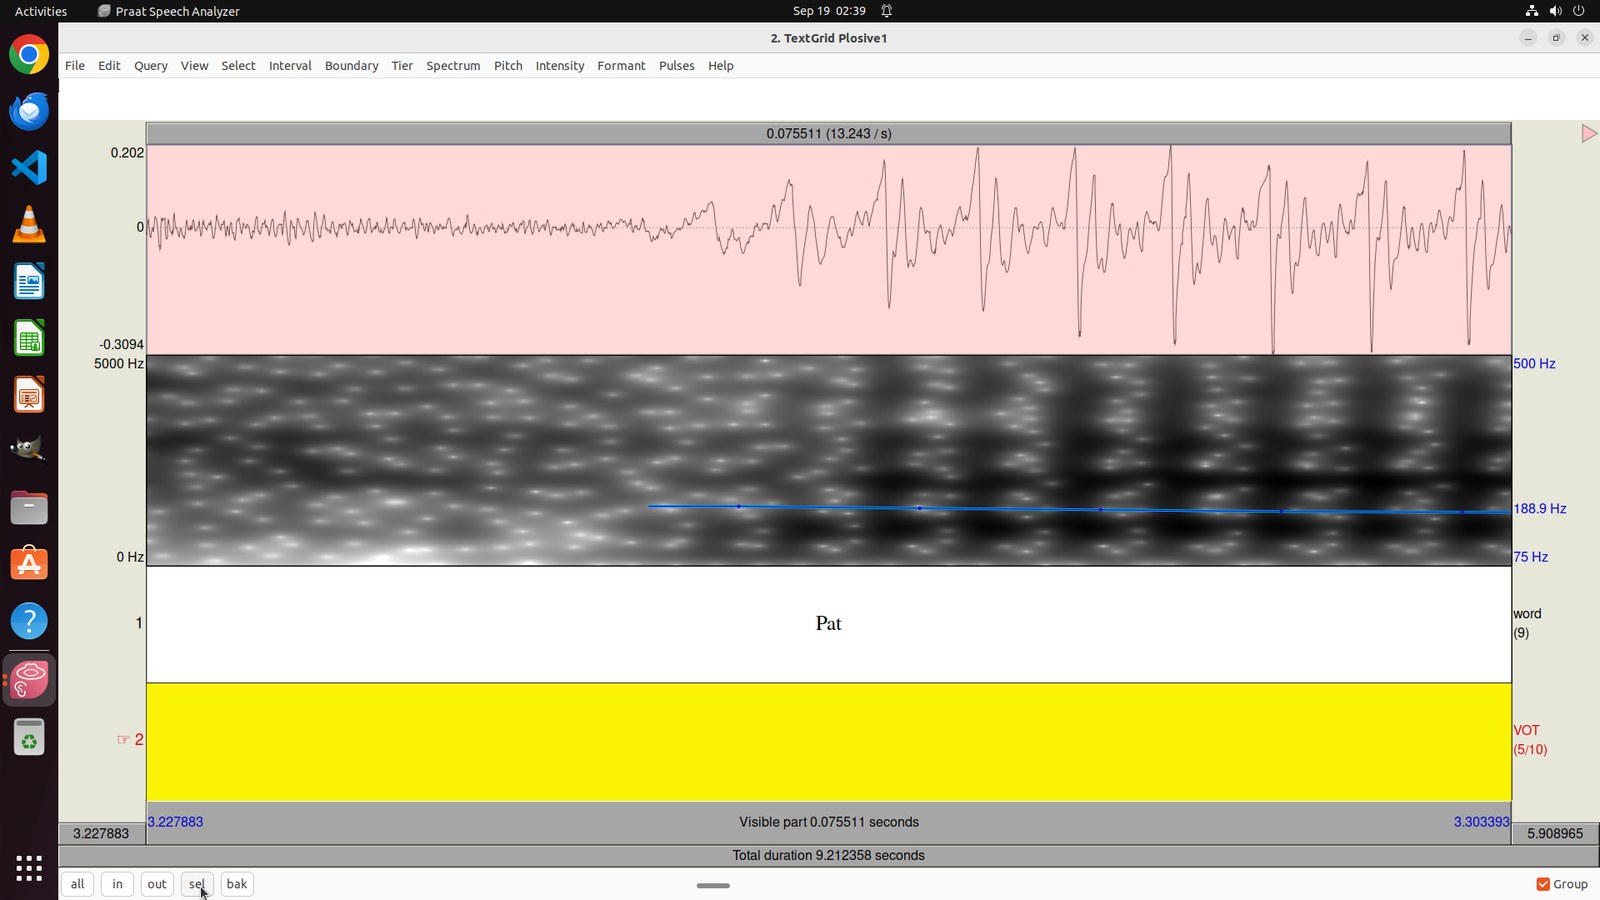
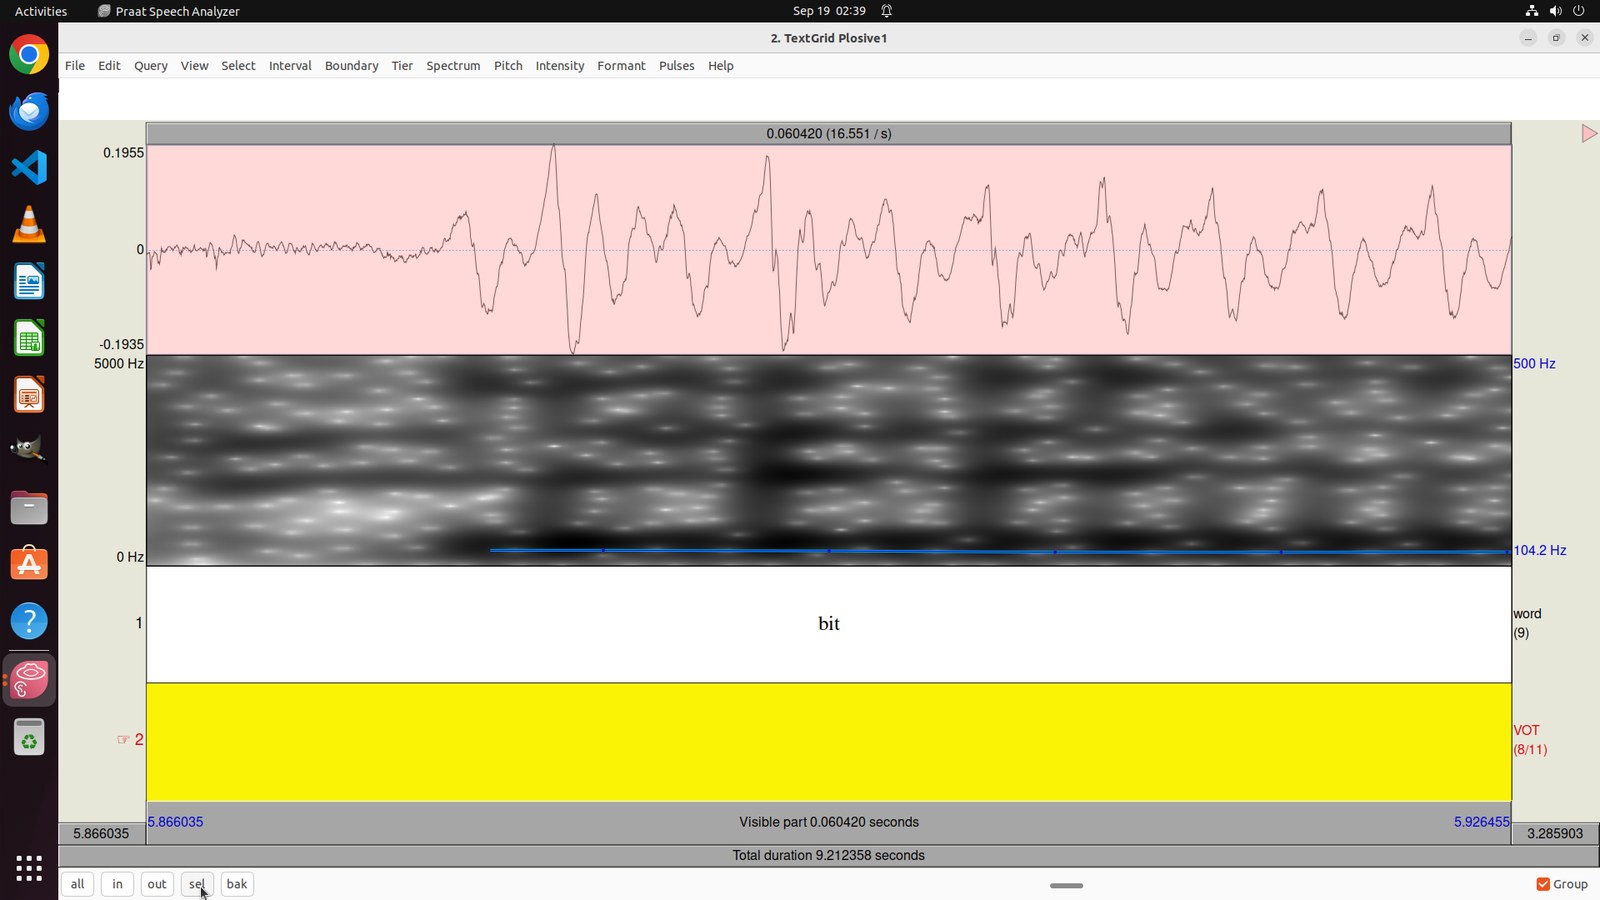
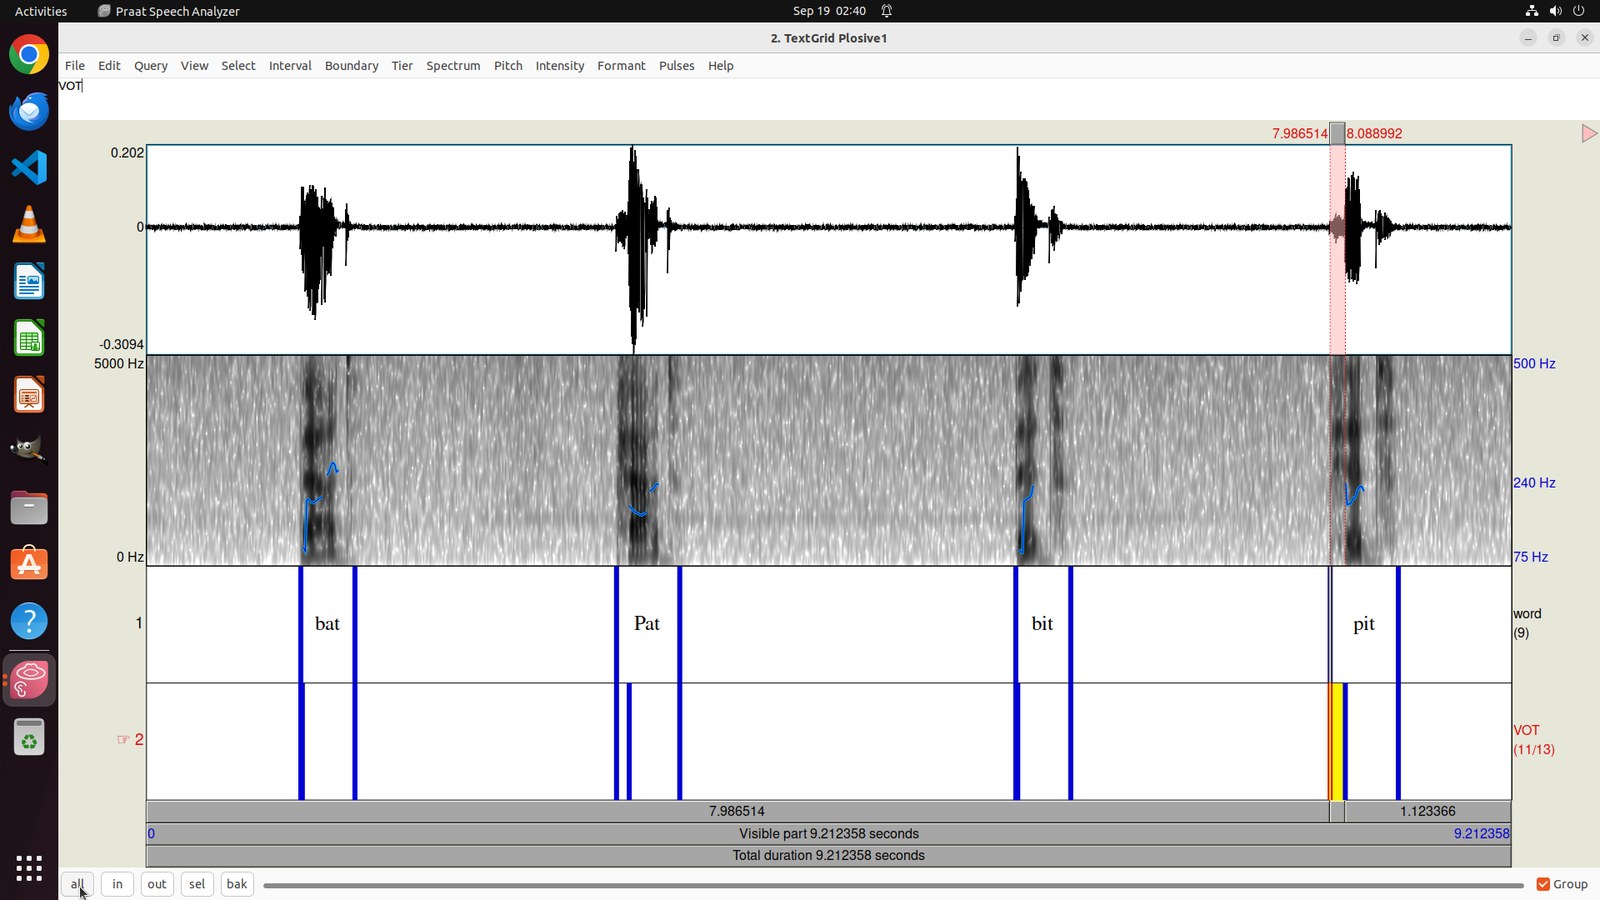
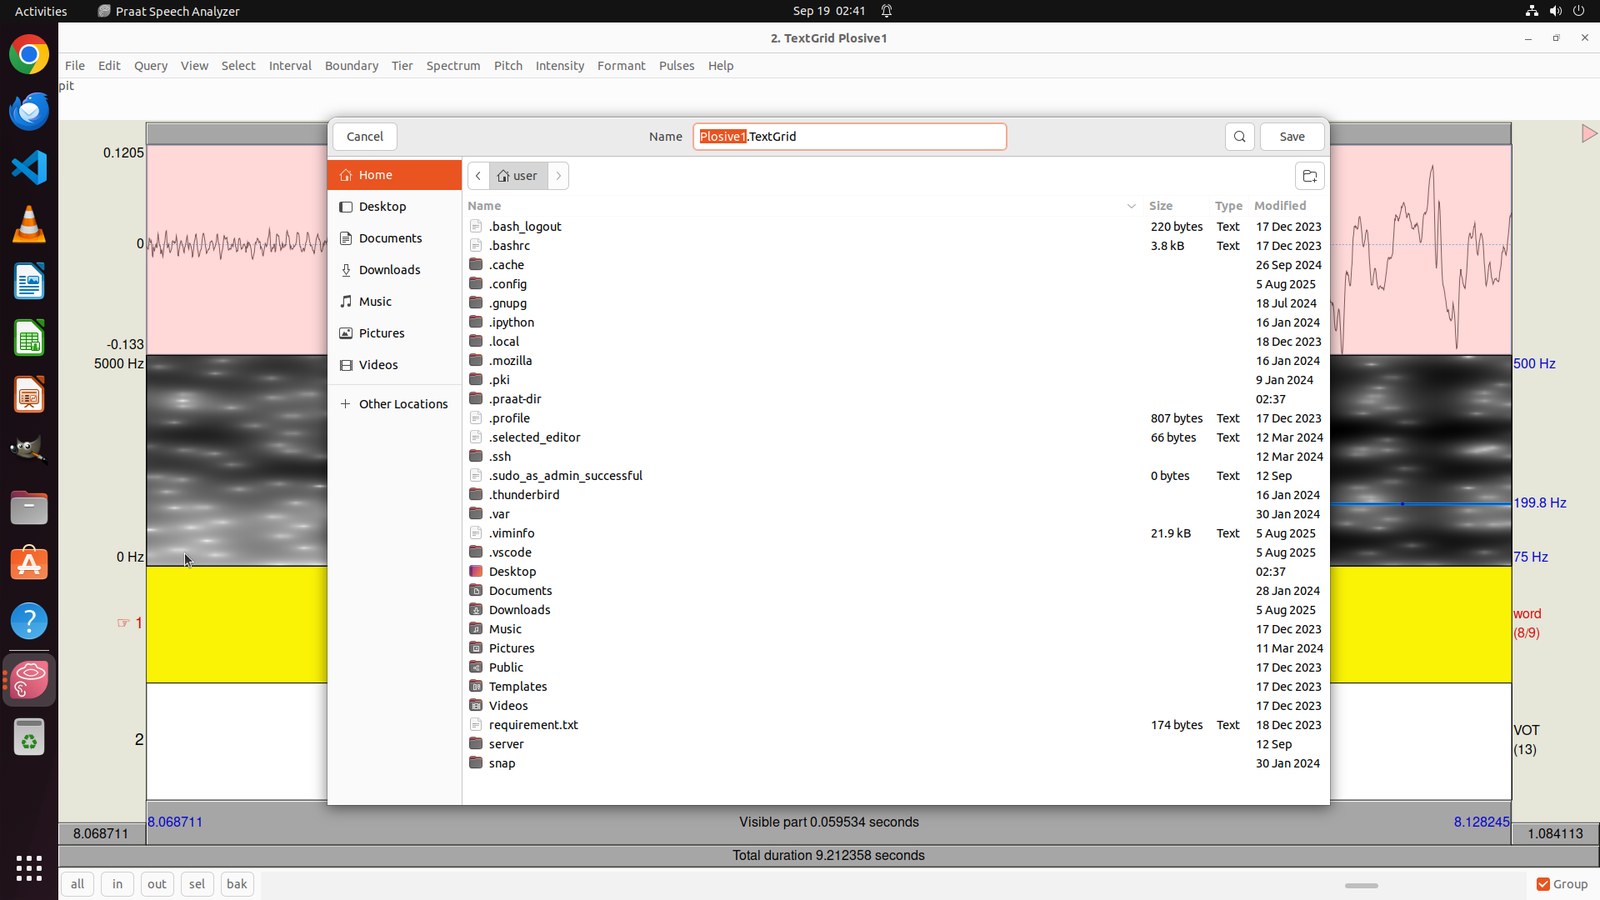
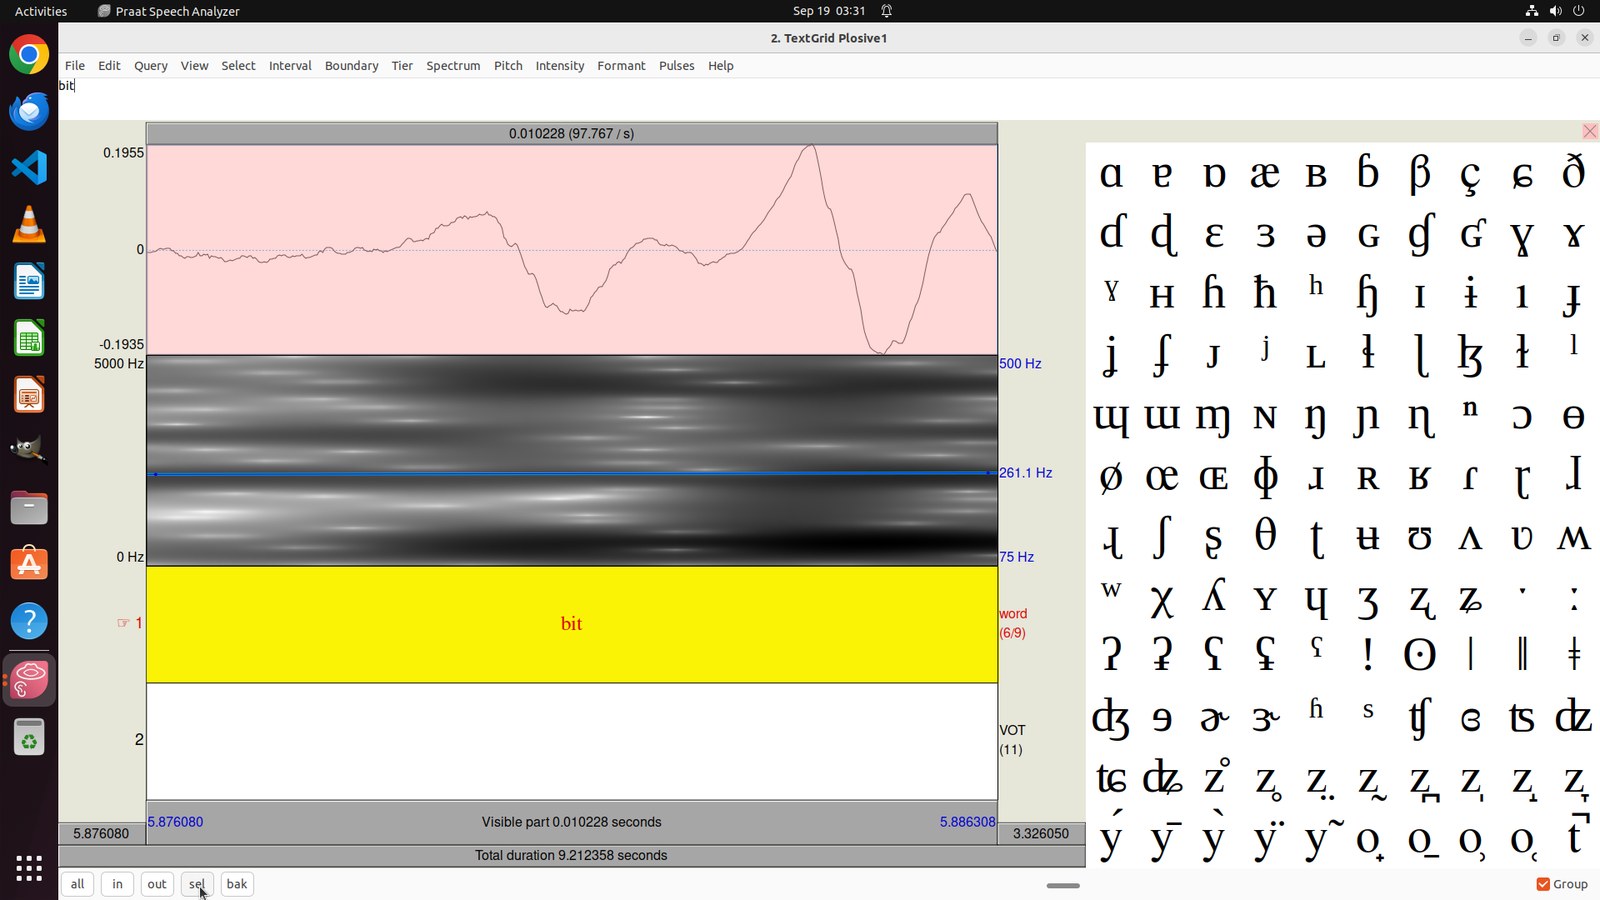
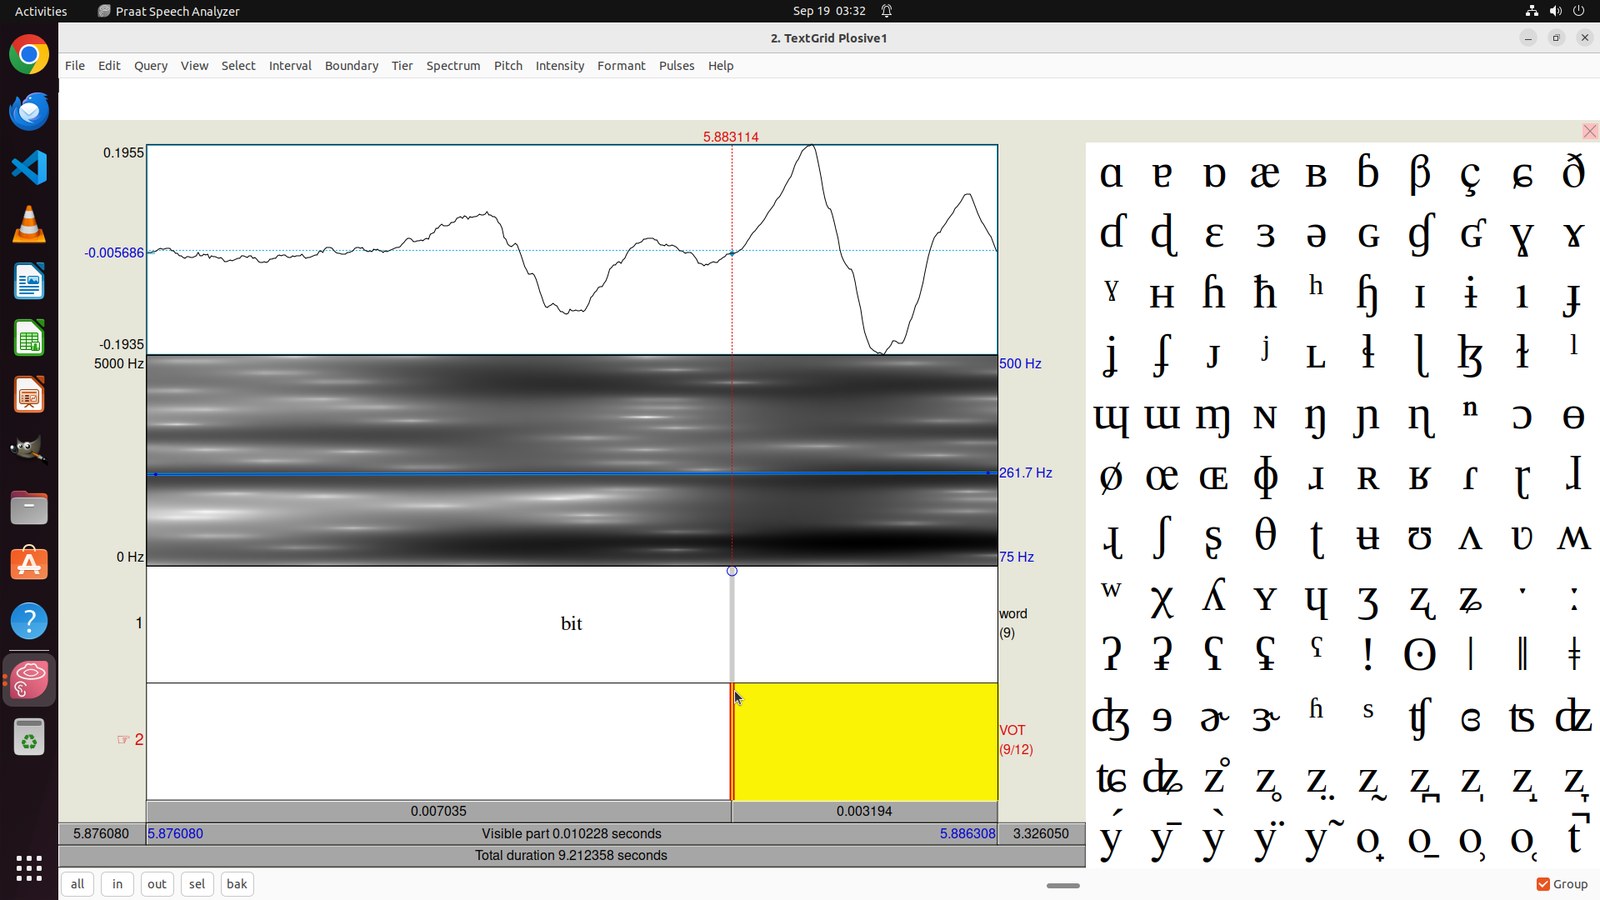
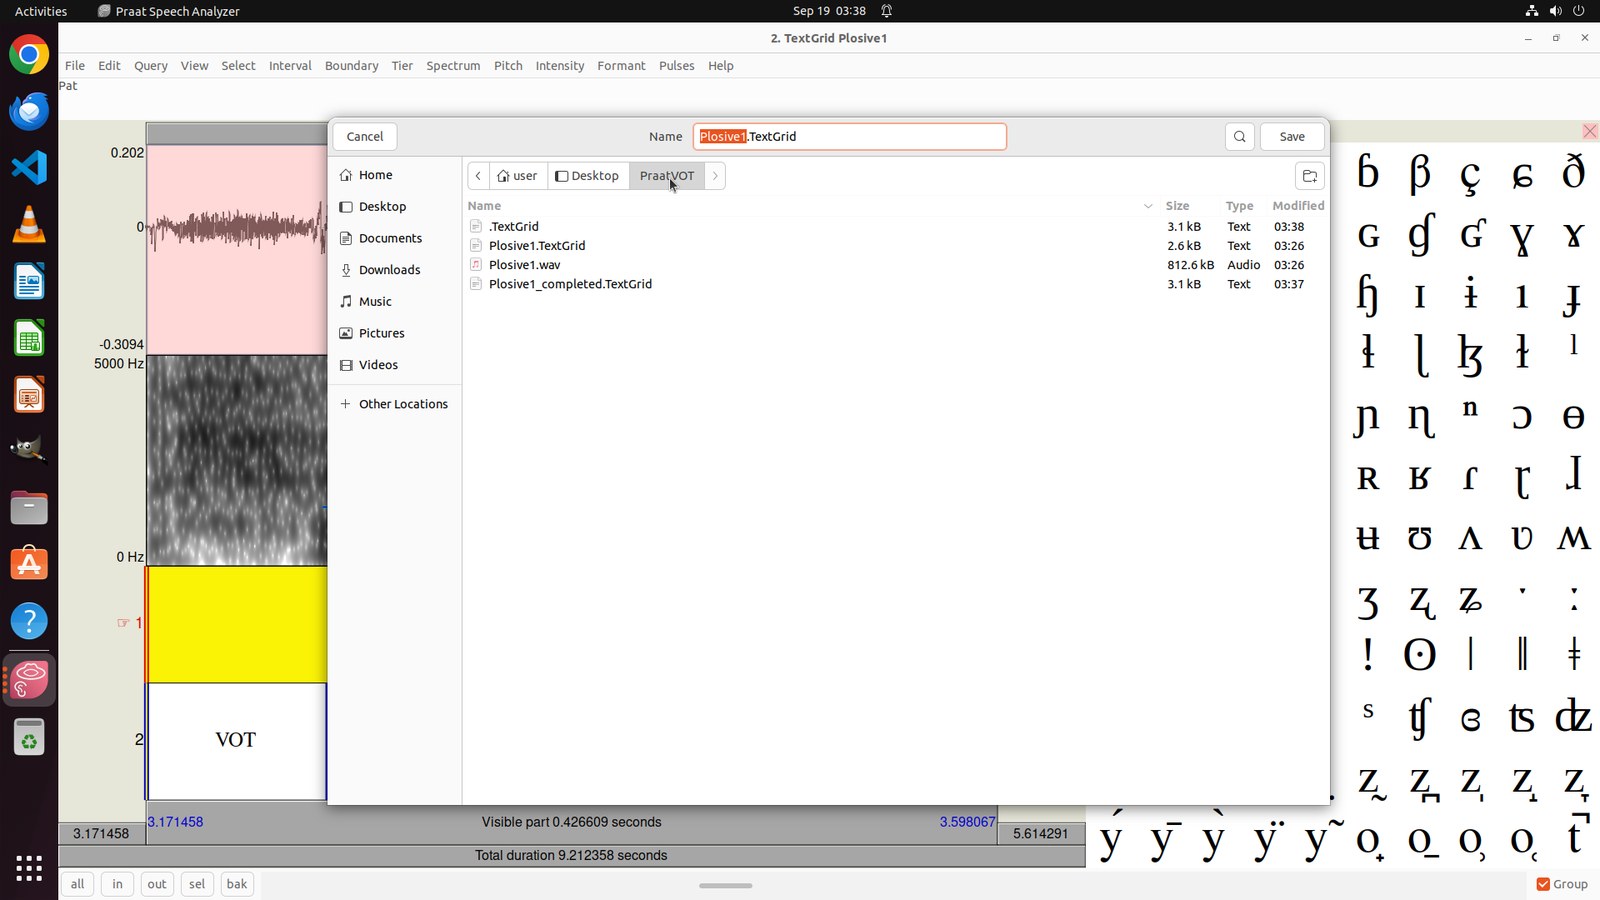
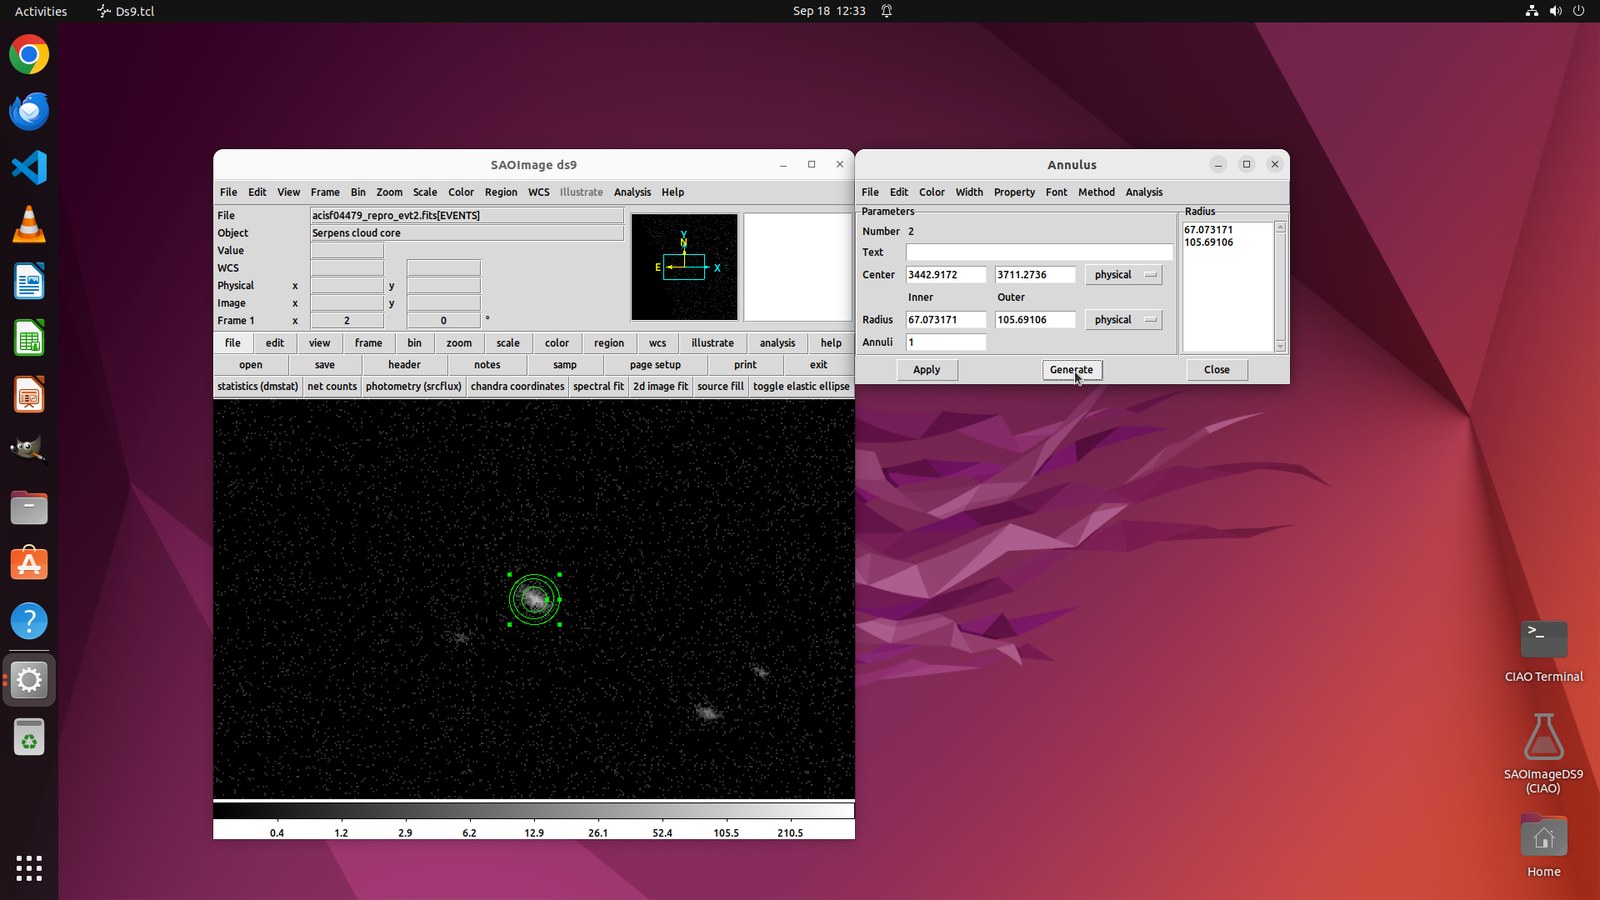
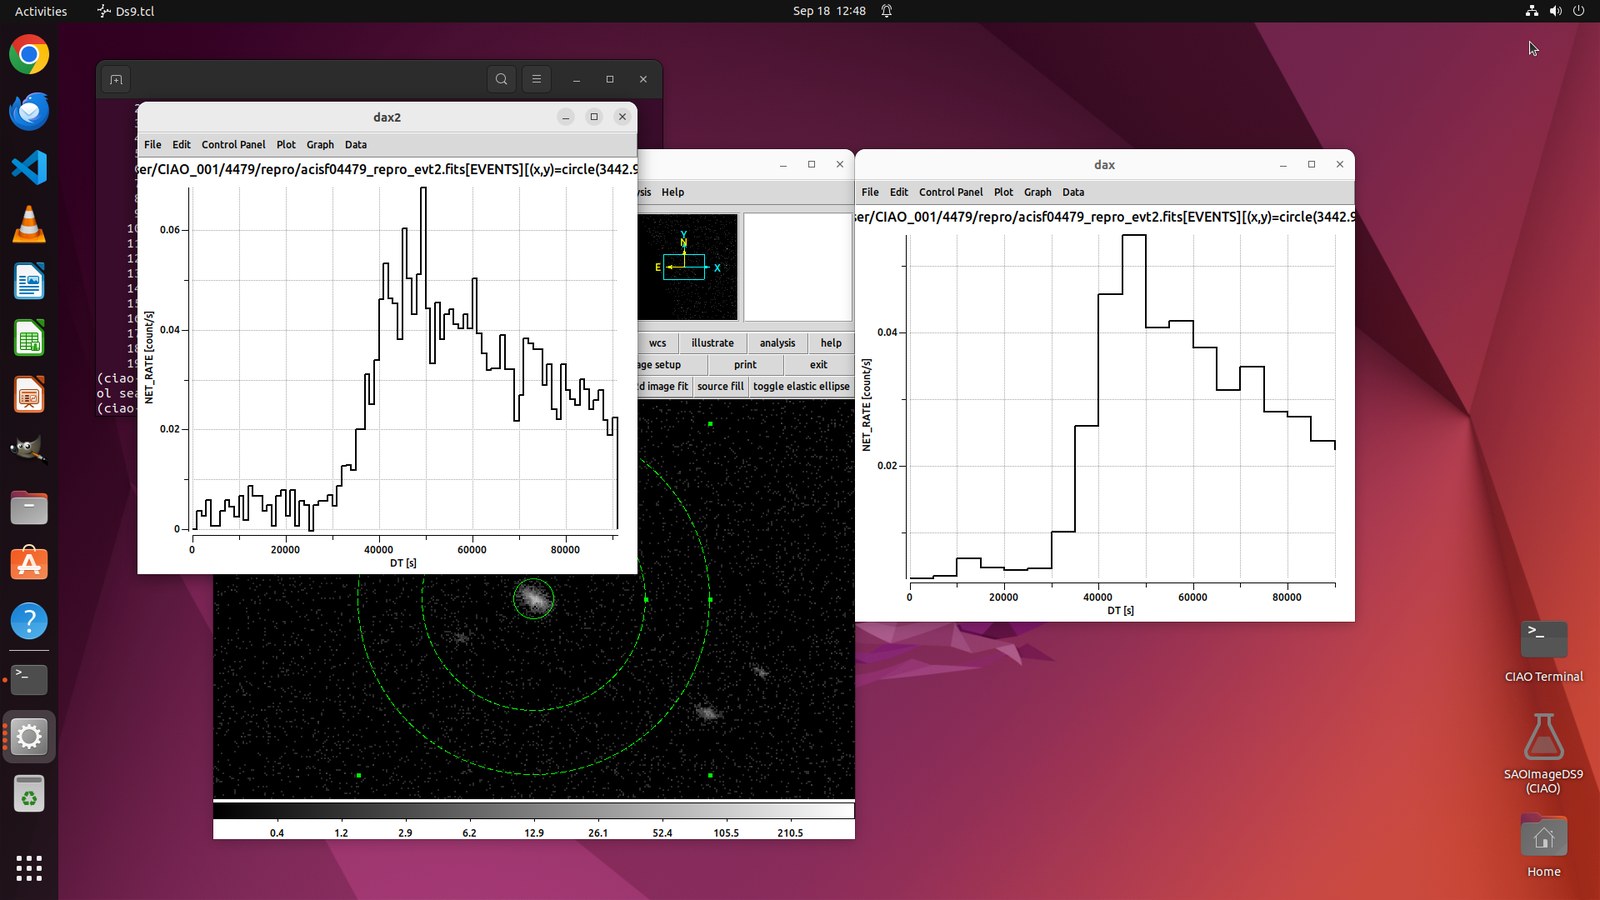
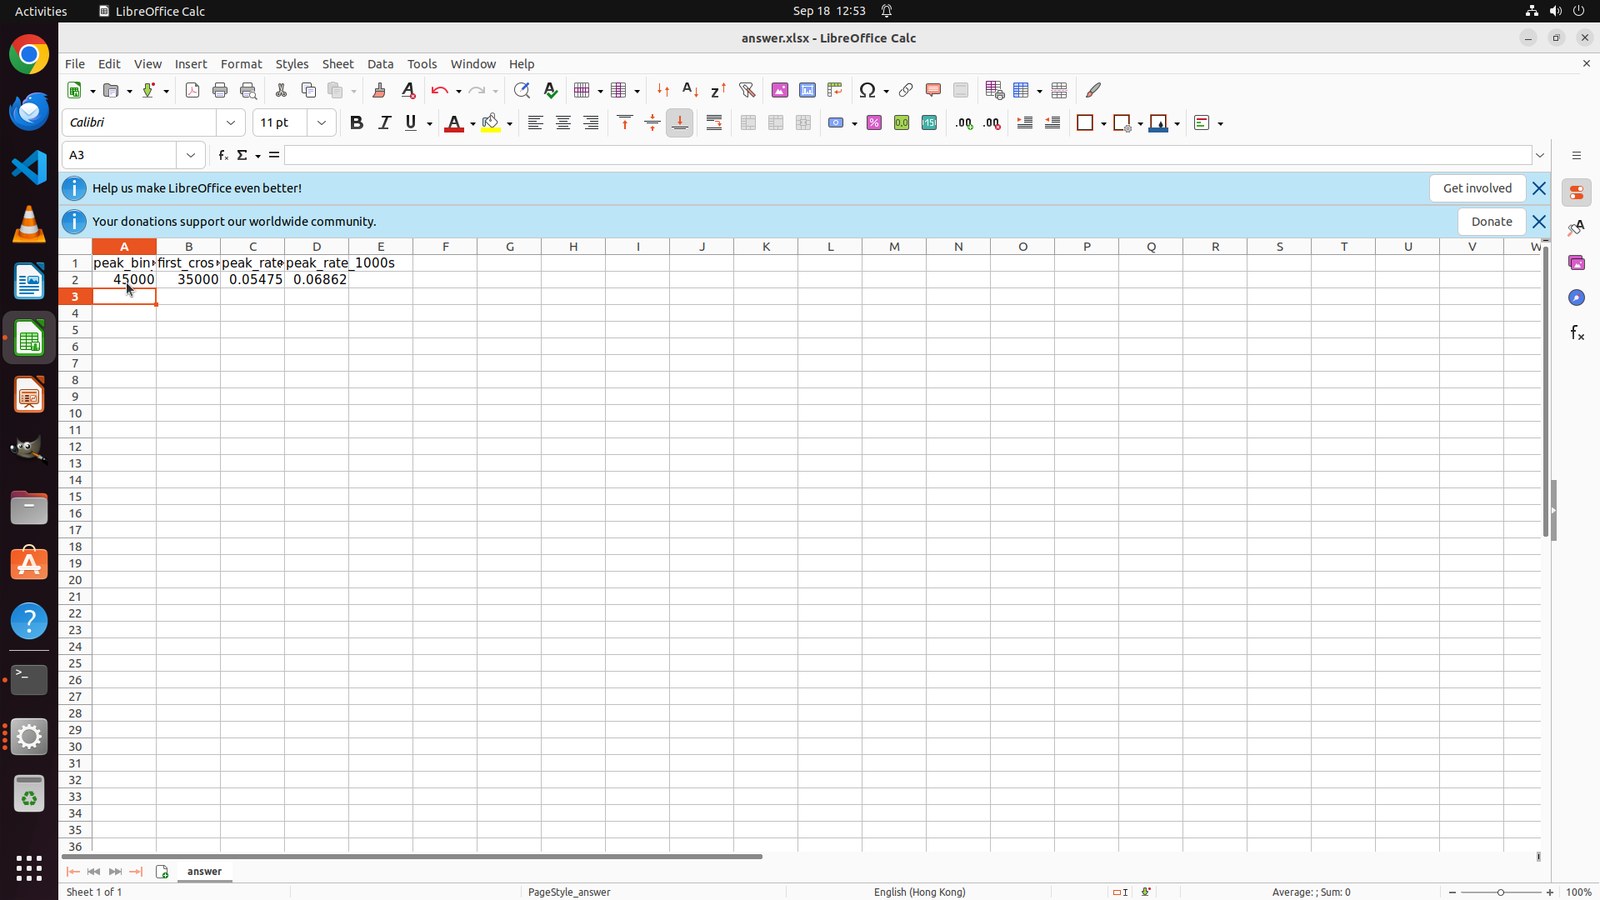
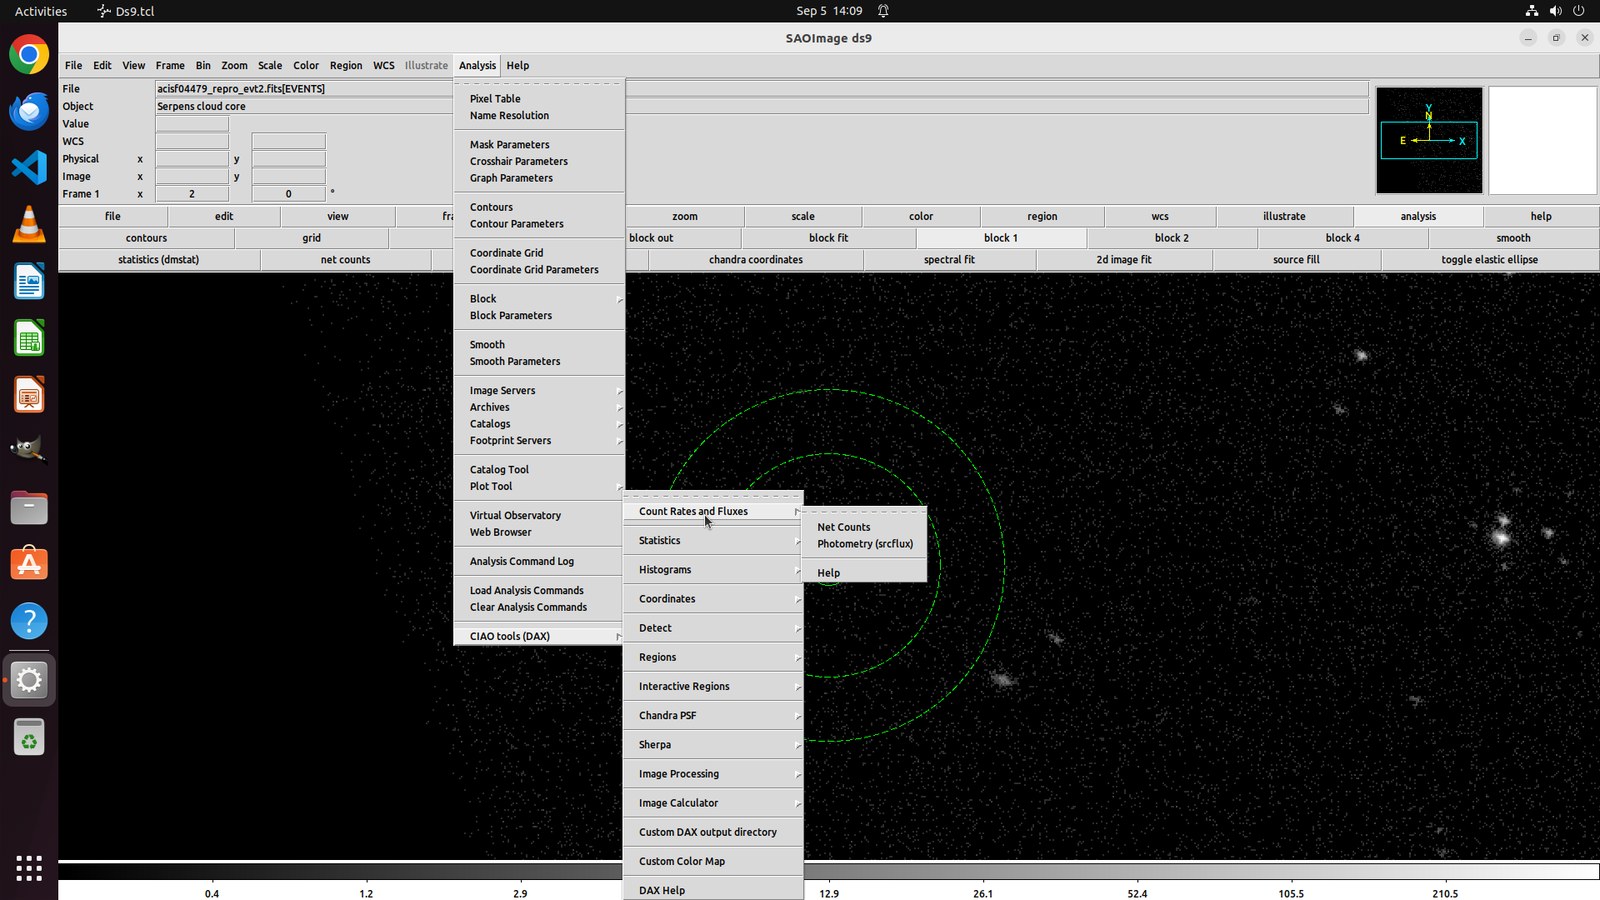
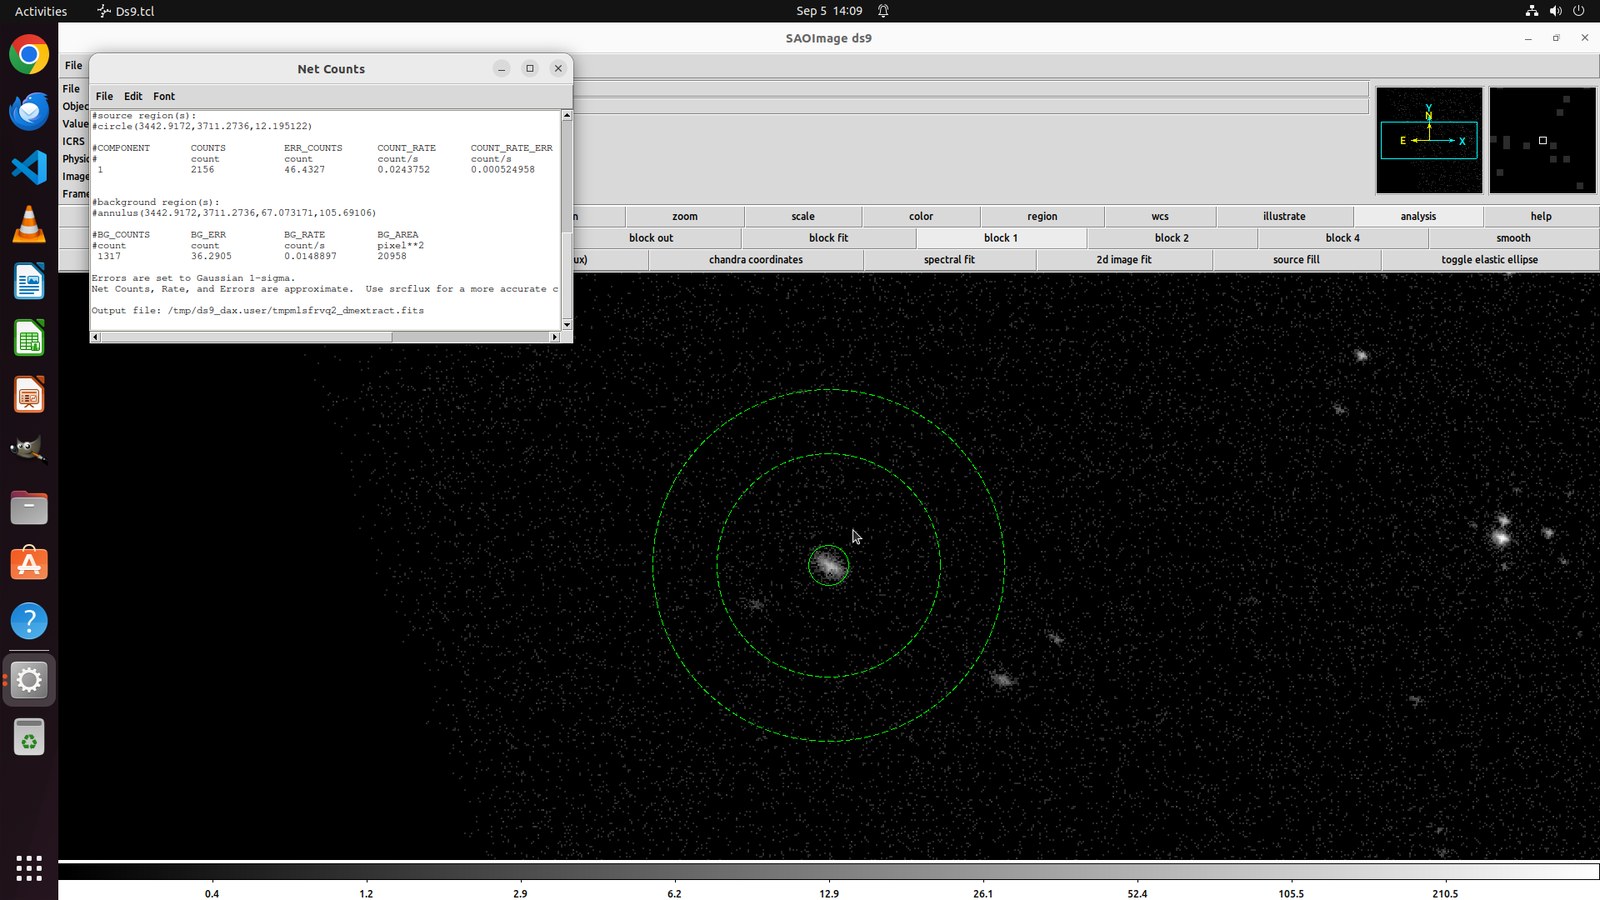
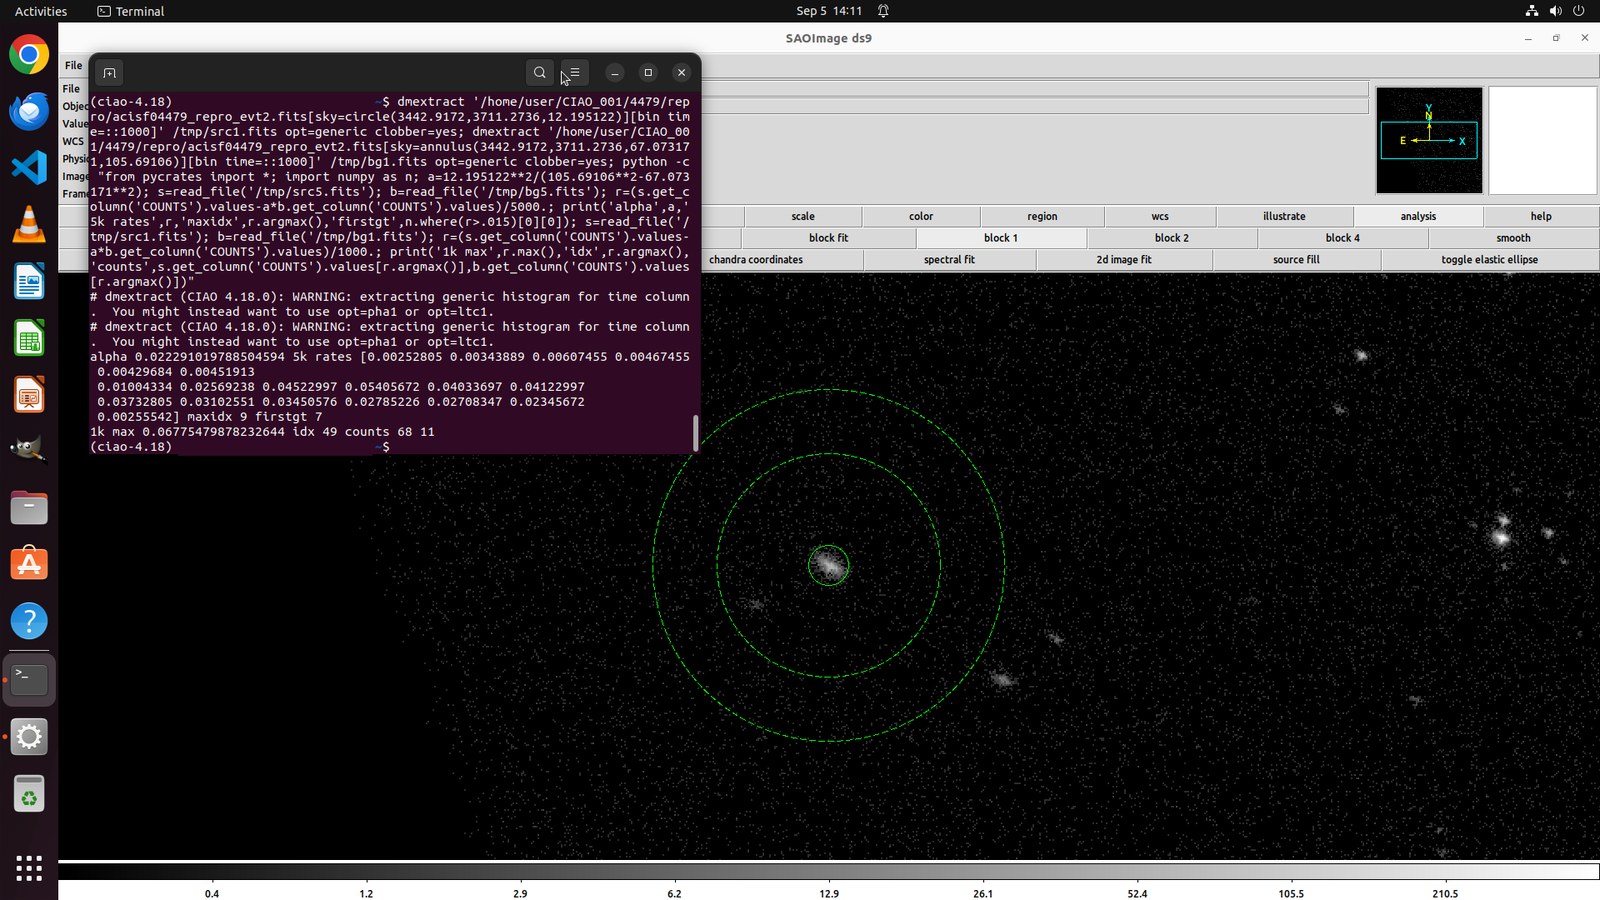
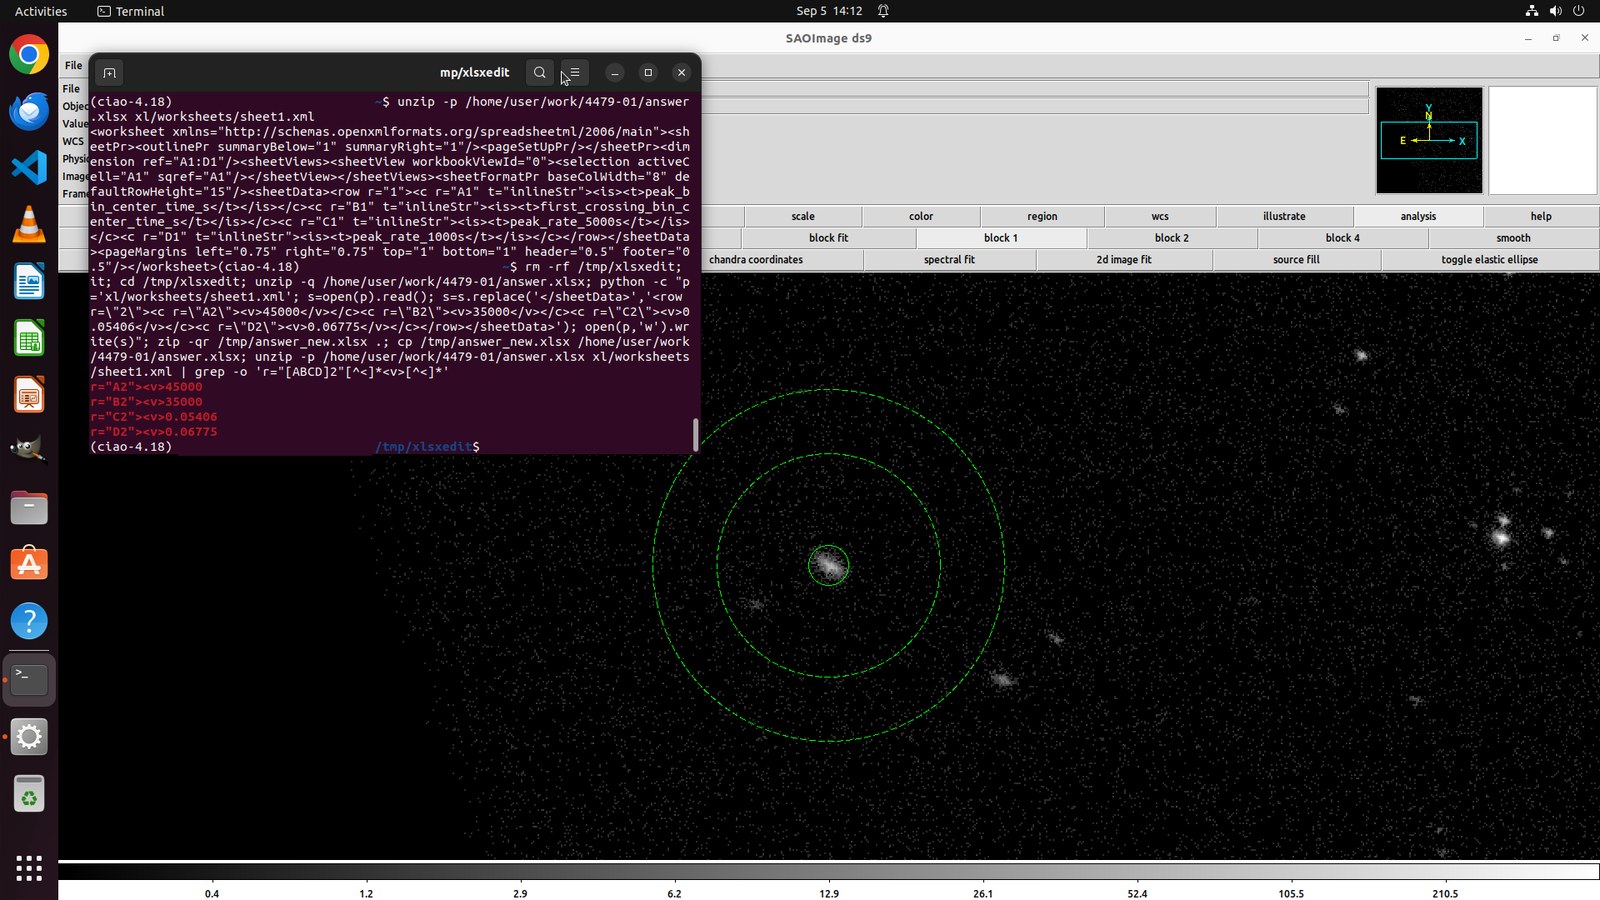
81 real agent trajectories across nine scientific applications, played at 1.5× speed.
7 Scientific domains
14 Software configurations
146 Expert-designed tasks
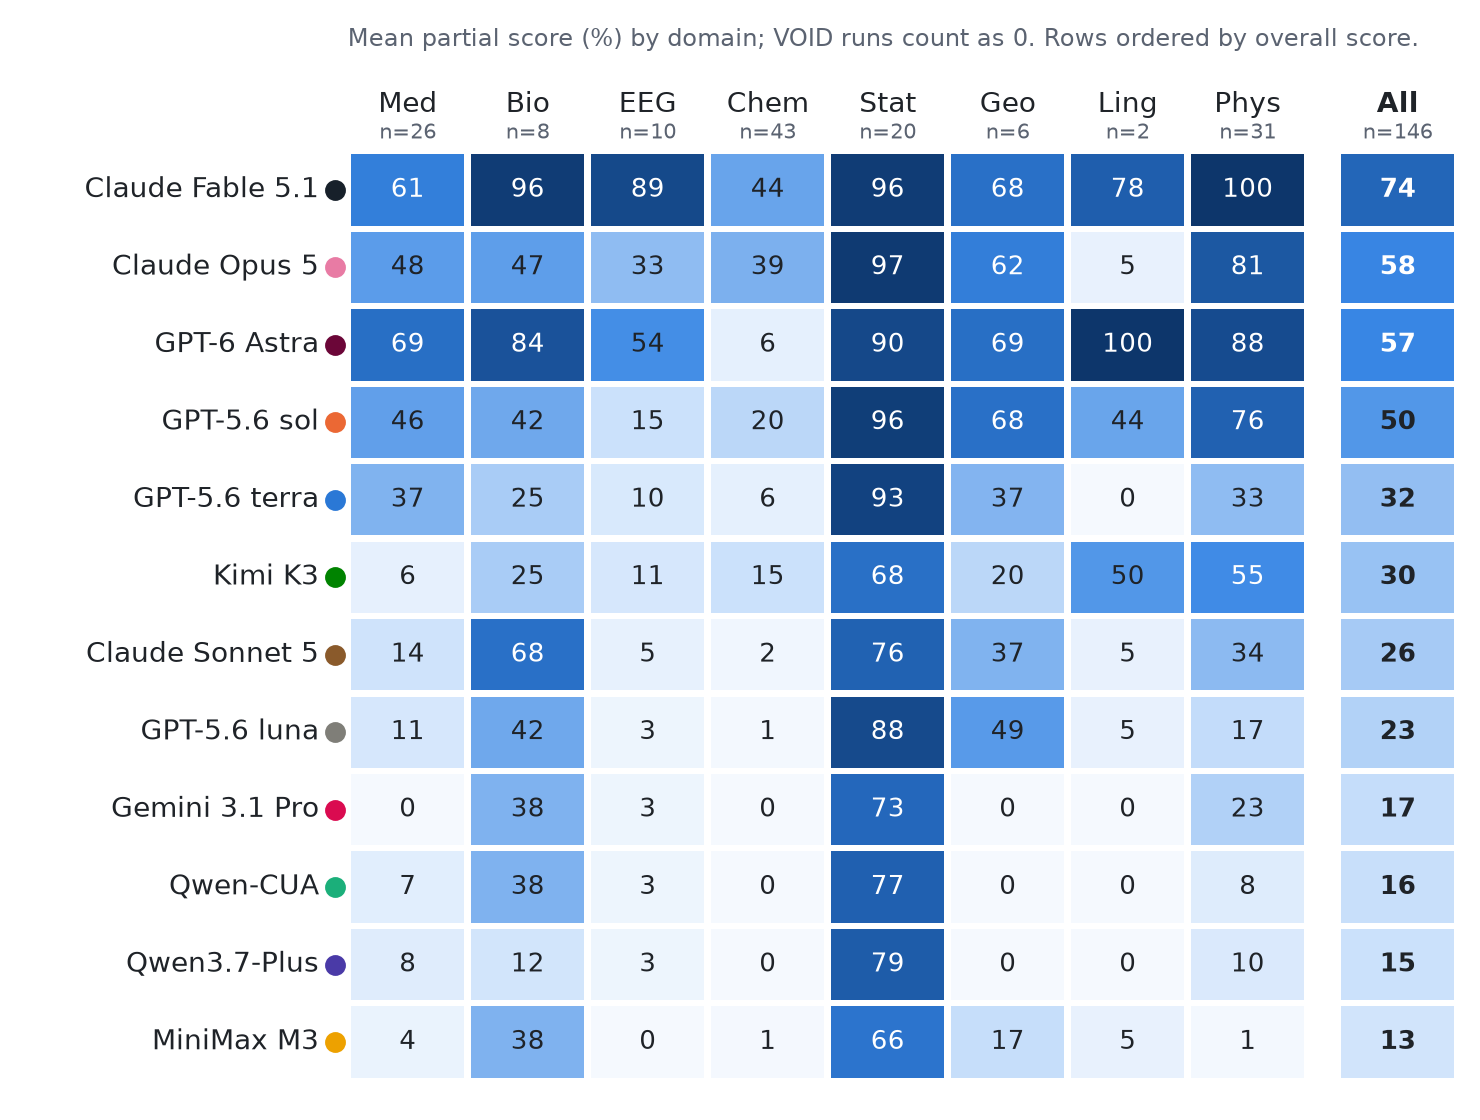
34.3% Average score across 12 models

Abstract

Scientific software presents a demanding test for computer-using agents based on visual language models (VLMs): completing a research workflow requires interpreting specialized interfaces, manipulating scientific objects, and producing verifiable results. We thus introduce OSWorld-Science, a benchmark and evaluation environment that combines scientifically meaningful tasks, artifact-based evaluation, and an efficient agent harness for studying computer use in the scientific domain. The benchmark contains 12 VLMs and 146 high-quality tasks across several scientific domains and software configurations, covering workflows such as molecular drawing and retrosynthesis, pathology image analysis, statistical computing, and physical simulation. Tasks are developed through expert proposals and iterative human–AI co-design, with selection guided by scientific value and difficulty. Task-specific execution-based evaluators inspect application states and generated artifacts, including molecular structures, segmentation masks, plots, and numerical results, and award partial credit for incomplete outcomes. Our special harness integrates model adapters, interaction-loop control, and trajectory logging to support comparisons of models and interaction strategies. This combination makes OSWorld-Science a testbed for examining how agents coordinate visual interpretation with graphical and command-line actions. Our results shows that current state-of-the-art VLMs with a strong harness still face challenges in addressing key questions in the scientific domains. We also analyze the benchmarking results across multi-linguistics, reasoning efforts, context length and other factors and derive several important conclusions and directions to assist future development. Overall, we provide an integrated framework connecting expert-defined scientific goals to verifiable software outcomes, enabling systematic evaluation of both agent capabilities and harness design in scientific workflows. We also welcome public contributions now: Link!

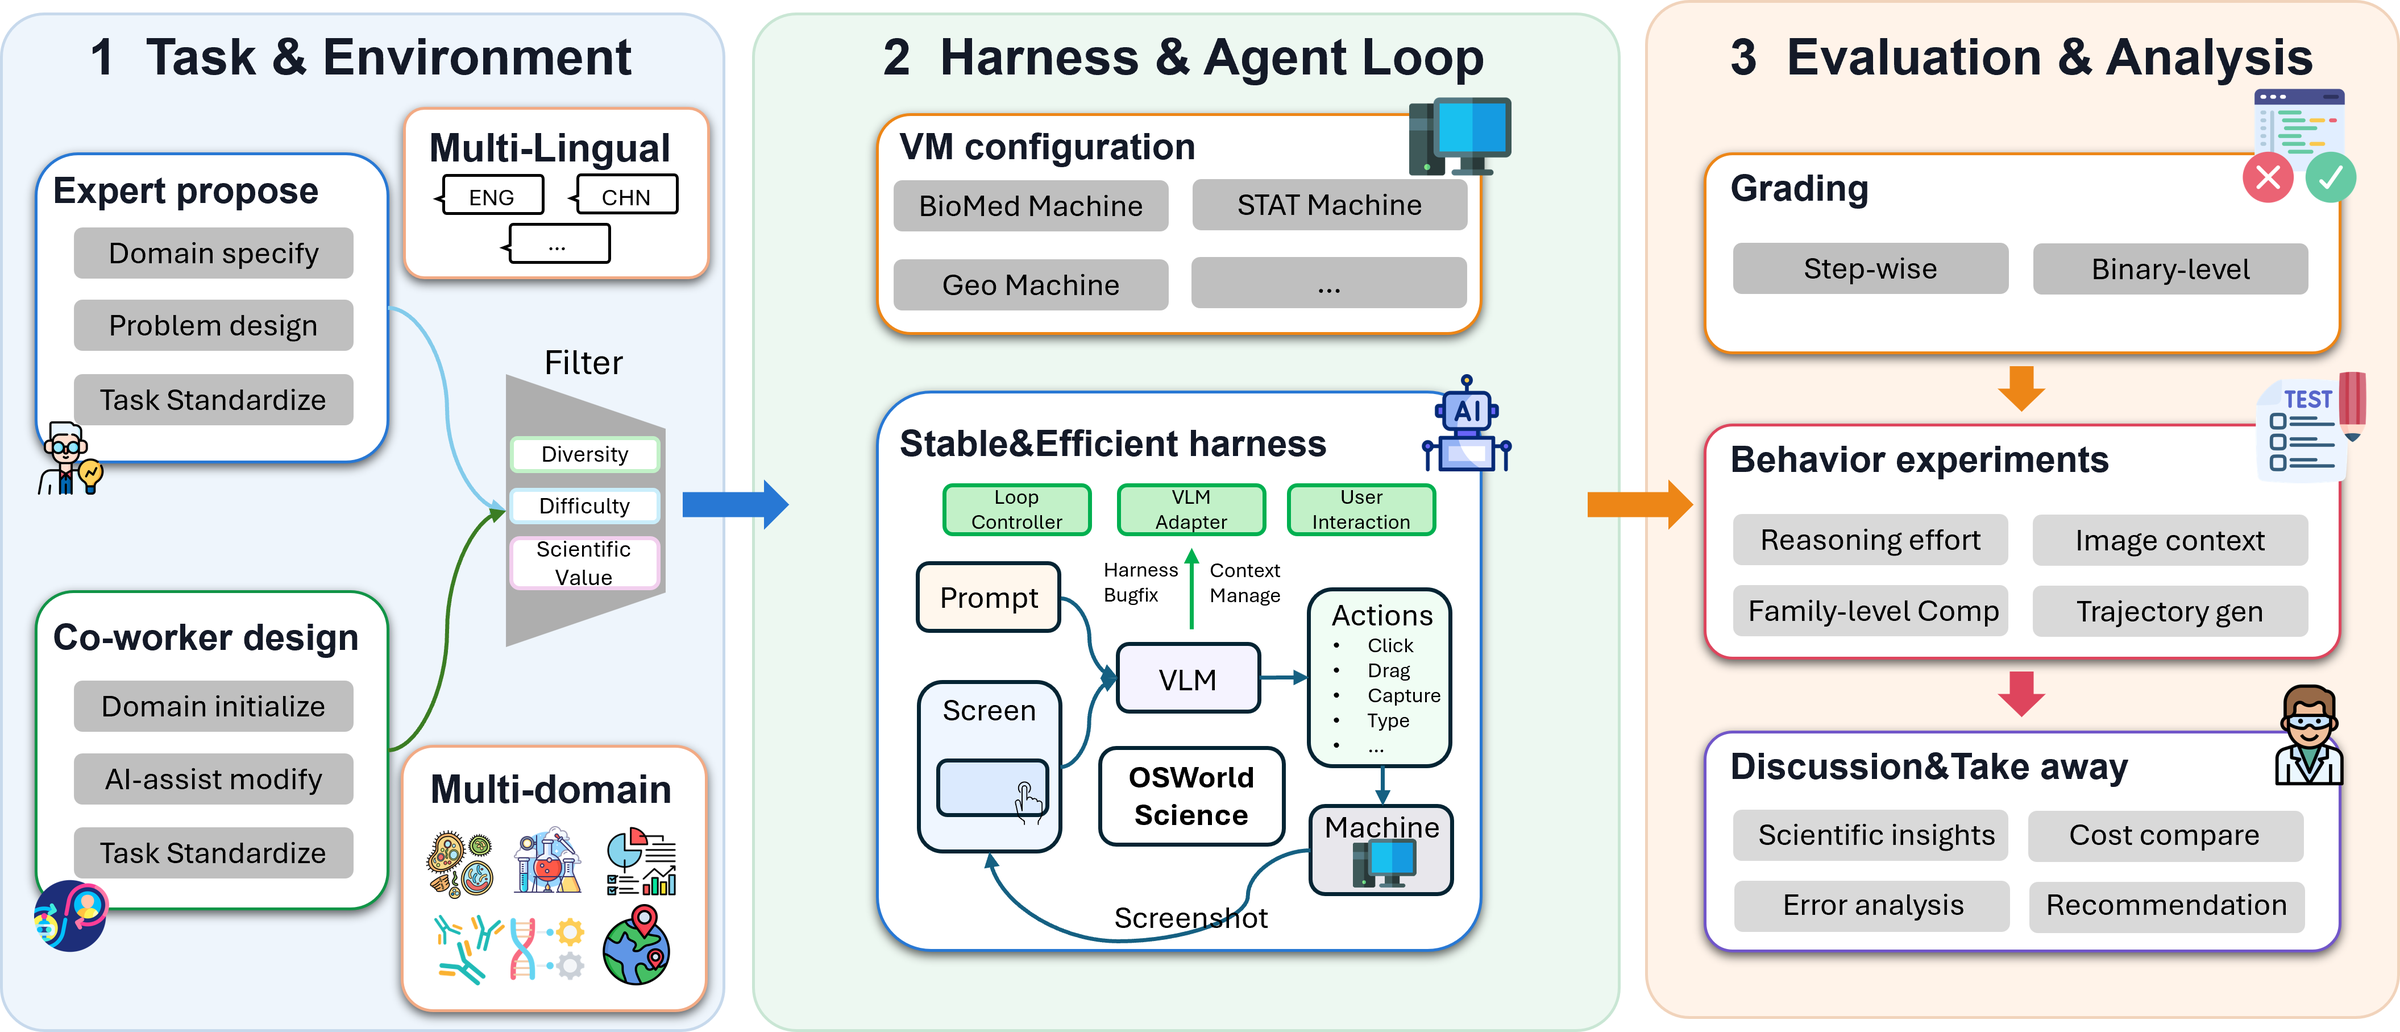
Overview of OSWorld-Science in three panels: 1, task and environment (expert proposal, co-worker design, filtering by diversity, difficulty and scientific value, multilingual and multi-domain tasks); 2, harness and agent loop (VM configurations, loop controller, VLM adapter, screenshots and actions); 3, evaluation and analysis (step-wise and binary grading, behavior experiments, discussion).
Overview of OSWorld-Science: expert task design and filtering, the evaluation harness and agent loop, and the grading and behavior analyses.

Score, Tokens and Cost

Twelve models, one run per task at their default reasoning effort. Pick a task set, then compare the mean score with output tokens or cost per task.

X
Y

Partial = mean task score with partial credit; Binary = share of tasks scored 1; VOID runs count as 0. Output tokens include thinking tokens. Cost and output tokens come from the results workbook (its recorded cost, or its input and output tokens at list prices); where it has no usage (Statistics output tokens, radiology, linguistics) they come from the released trajectory records. Kimi K3's Bio cost is its reported total, counted as output tokens. Cost and tokens are averaged over tasks with recorded usage; a model without recorded usage for a set is left off that axis and shown as "--" in the table.

Model Output tokens / task Partial score Binary score

Task Statistics

146 tasks in 7 scientific domains and 14 software configurations, proposed by domain experts and filtered for diversity, difficulty and scientific value.

Interaction Demands

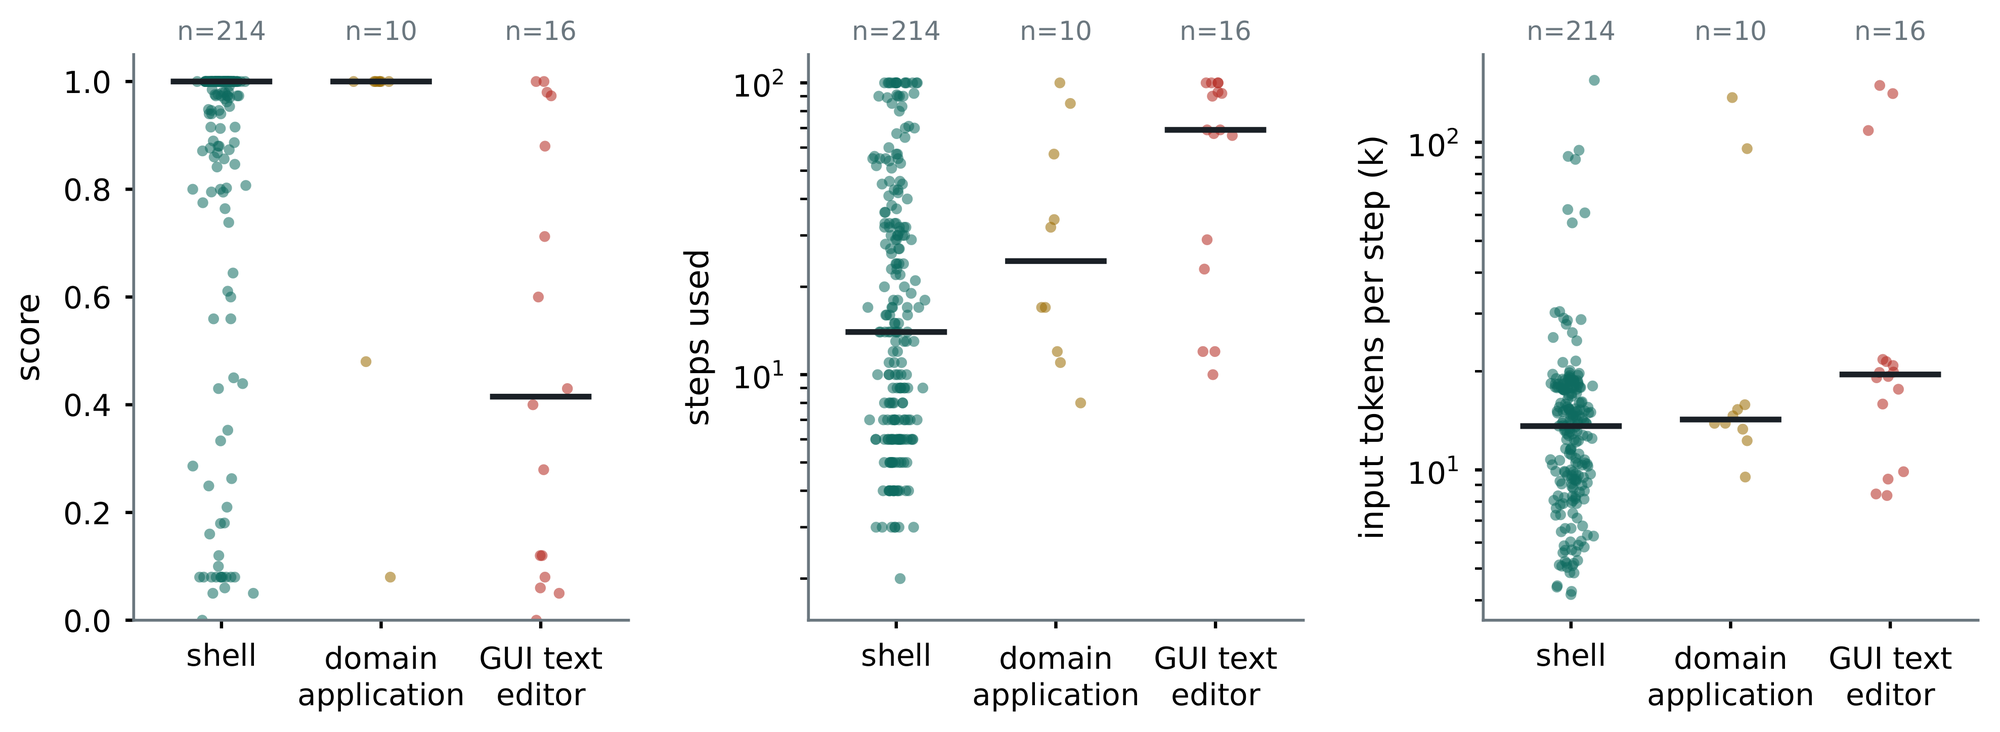
All 146 tasks are observed through screenshots of the application. 122 of them (83.6%) also allow the command line, while 24 (16.4%) are GUI-only (ASKCOS retrosynthesis, PDF reading and Praat). Four software configurations, QuPath, ChemDraw, ASKCOS and SAS/R, carry 85 tasks.

Task Domain Distribution

Chemistry and physics carry half of the tasks; medicine, statistics and biology most of the rest. The inner ring is the domain, the outer ring the software each task runs in. Hover a segment or a logo for its count.

Software counts follow the graded task list. The capability tags and operation templates follow the task annotation sheet, which files one structure-recognition task under ASKCOS.

Required Capabilities

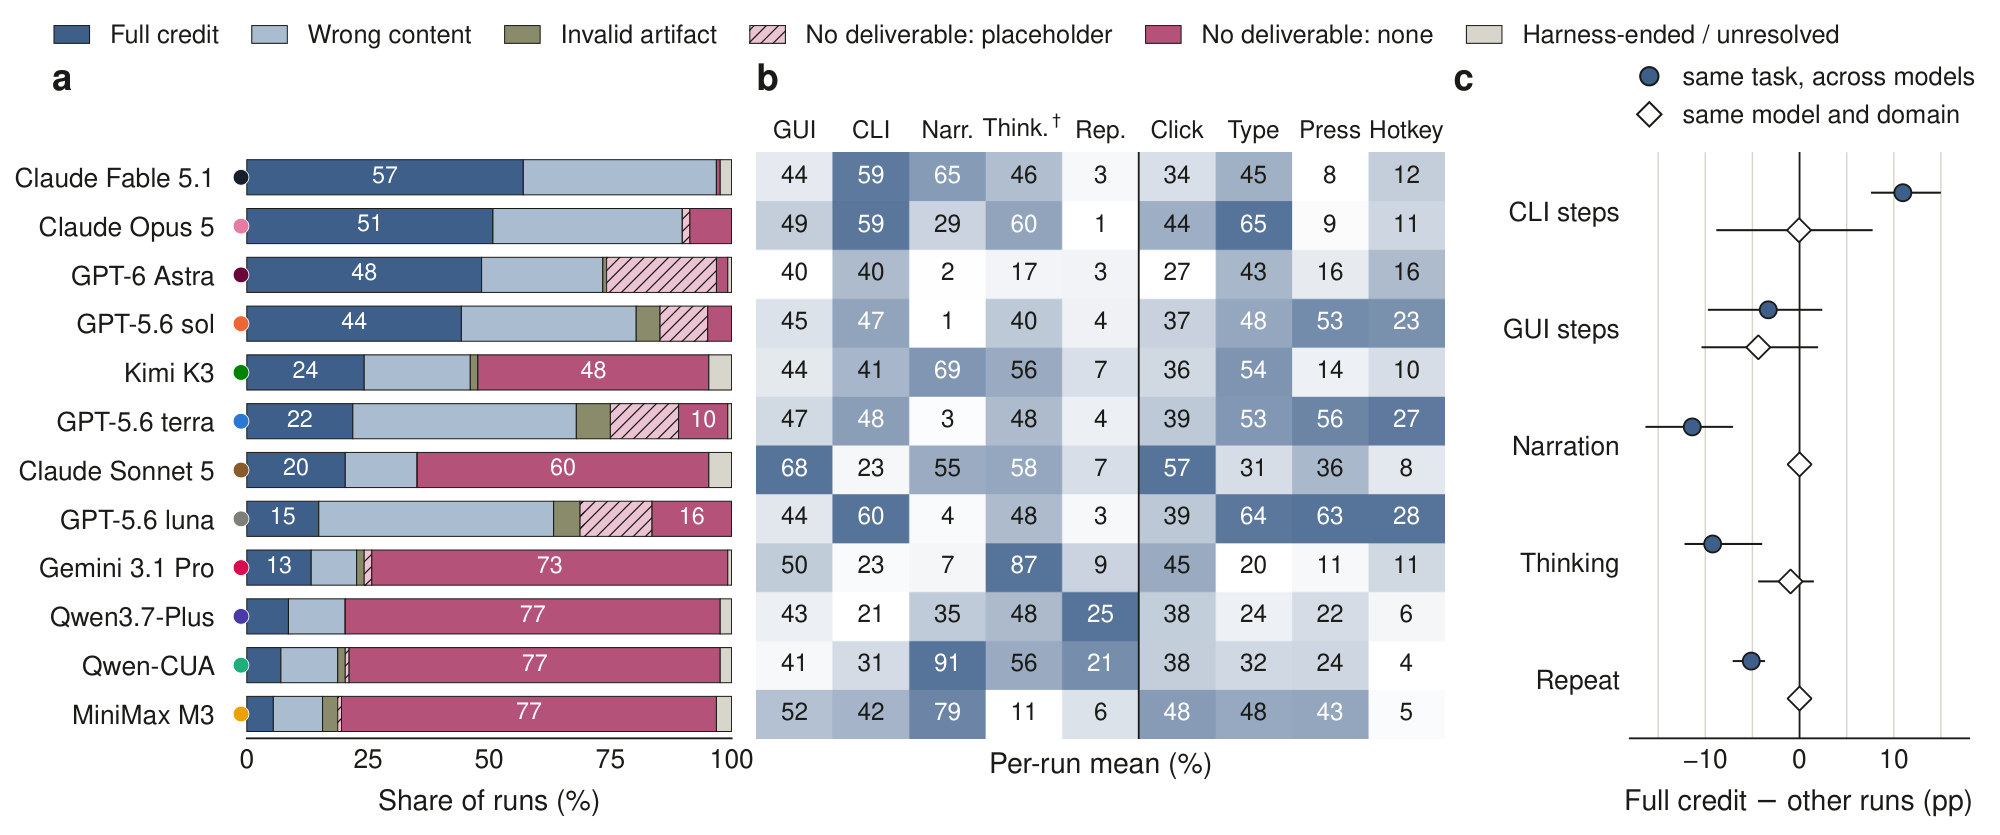
Besides screen observation, every task is annotated with the interaction primitives it needs: clicking in 124 tasks, typing in 101, drawing in 21, explicit screenshot capture in 21 and table analysis in 1. Tags are non-exclusive, so the 268 annotations exceed the task count.

Operation Templates

Each task follows one of 10 operation templates that describe what the agent must read and how it must act. Hover a template for its meaning.

Counts are over 146 tasks. Each task carries exactly one template. Two names are lightly reworded from the task annotations, which read “read sound file, text, click, type” and “read pdf, analyze table, out”.
Template Tasks Share
Read text, click, typeRead on-screen text or a data file, then drive the application with clicks and typed input (SAS/R, OpenFOAM, ANSYS, CIAO with DS9).5134.9%
Read pathology images, click, typeInspect a whole-slide image in QuPath, then annotate, measure or export through the GUI or scripting.2315.8%
Read PDF, take screenshot, drawFind a structure in a paper PDF, capture it, and redraw it in ChemDraw.2114.4%
Understand molecule, clickReason about a target molecule and navigate ASKCOS retrosynthesis results.2114.4%
Read signal file, text, click, typeLoad EEG recordings in EEGLAB, read the accompanying text, and run an analysis with typed parameters.106.8%
Understand molecule, click, typeWork with protein structures or NMR spectra in PyMOL or Mnova, typing identifiers and parameters.85.5%
Read geographic images, click, typeDigitize or analyze raster and vector layers in QGIS.64.1%
Read MRI images, click, typeReview radiology series in Weasis or 3D Slicer and record findings.32.1%
Read sound file, text, clickAcoustic inspection of recordings in Praat, driven by clicks only.21.4%
Read PDF, analyze table, outputExtract a table from a PDF and produce a derived result.10.7%

Leaderboard

Key Findings

Score and Token Budget

Case Studies

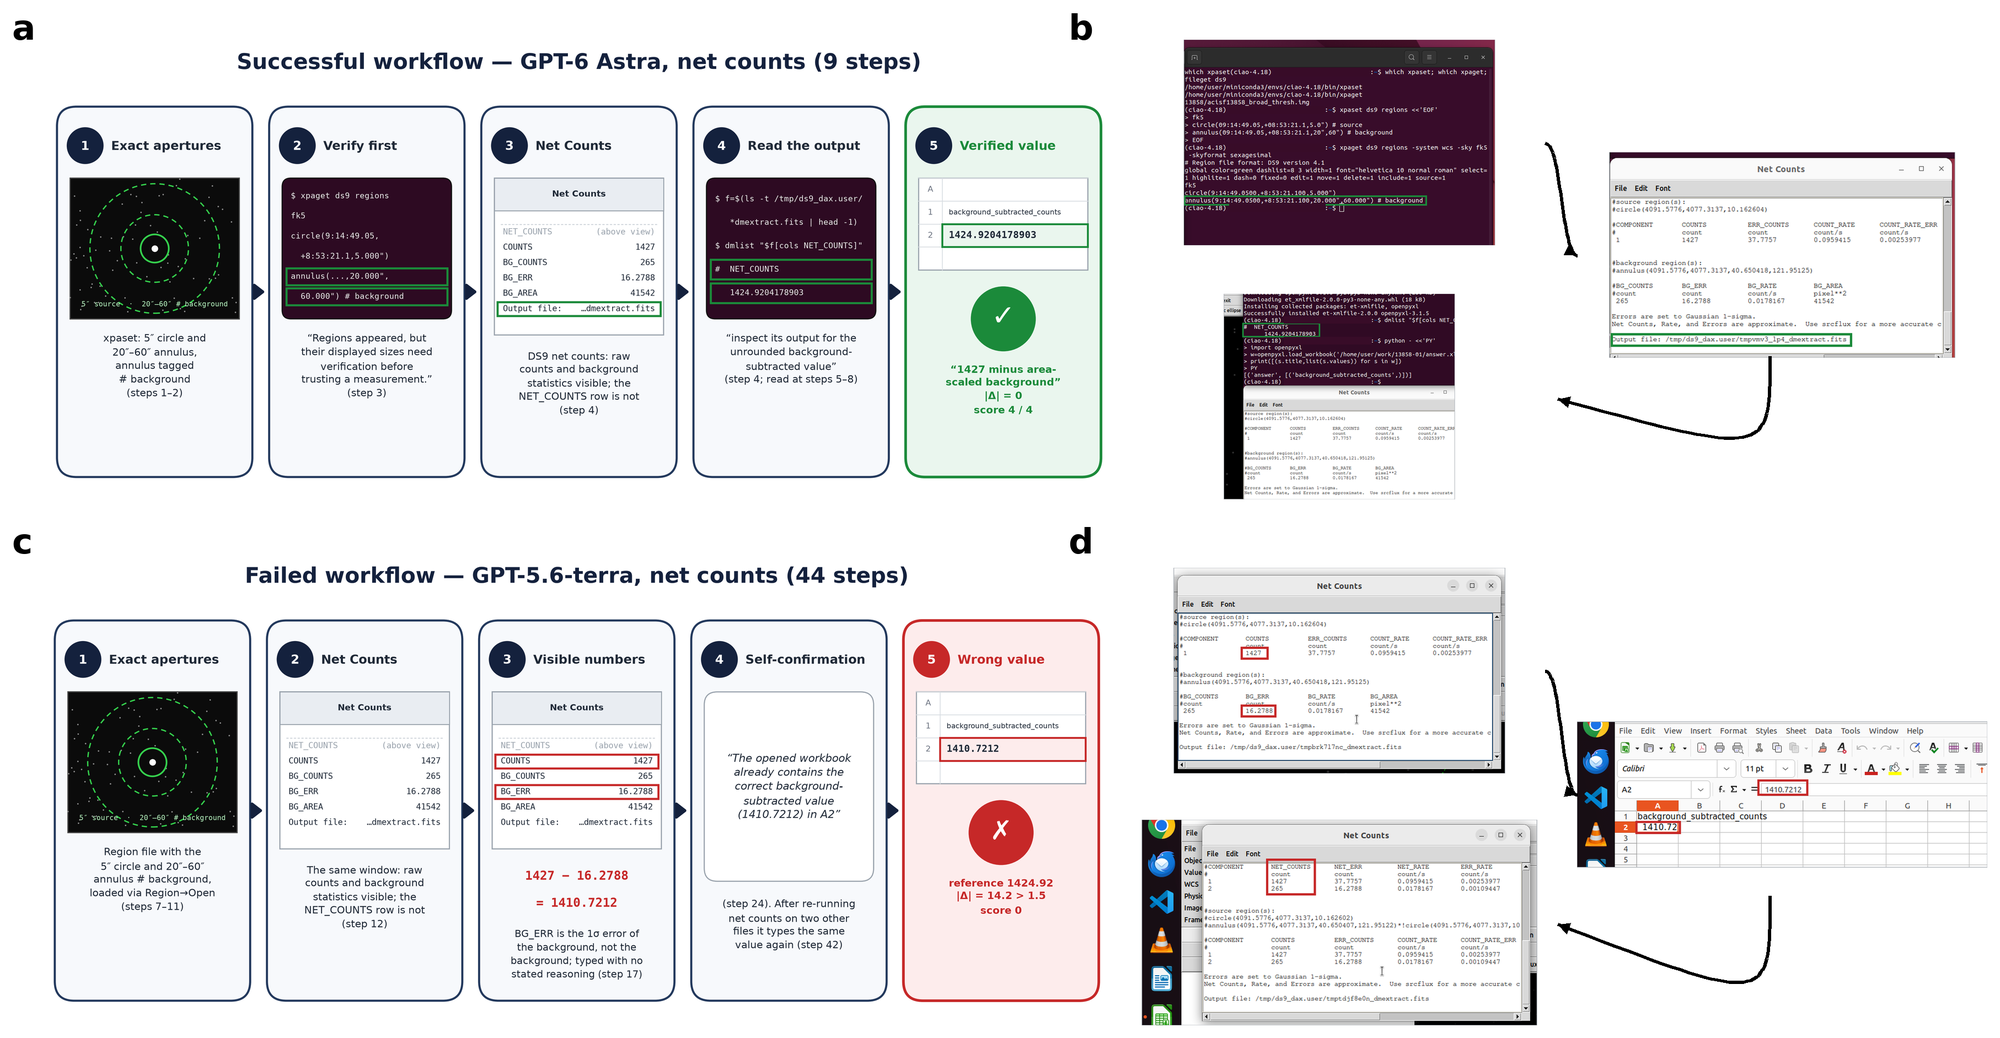
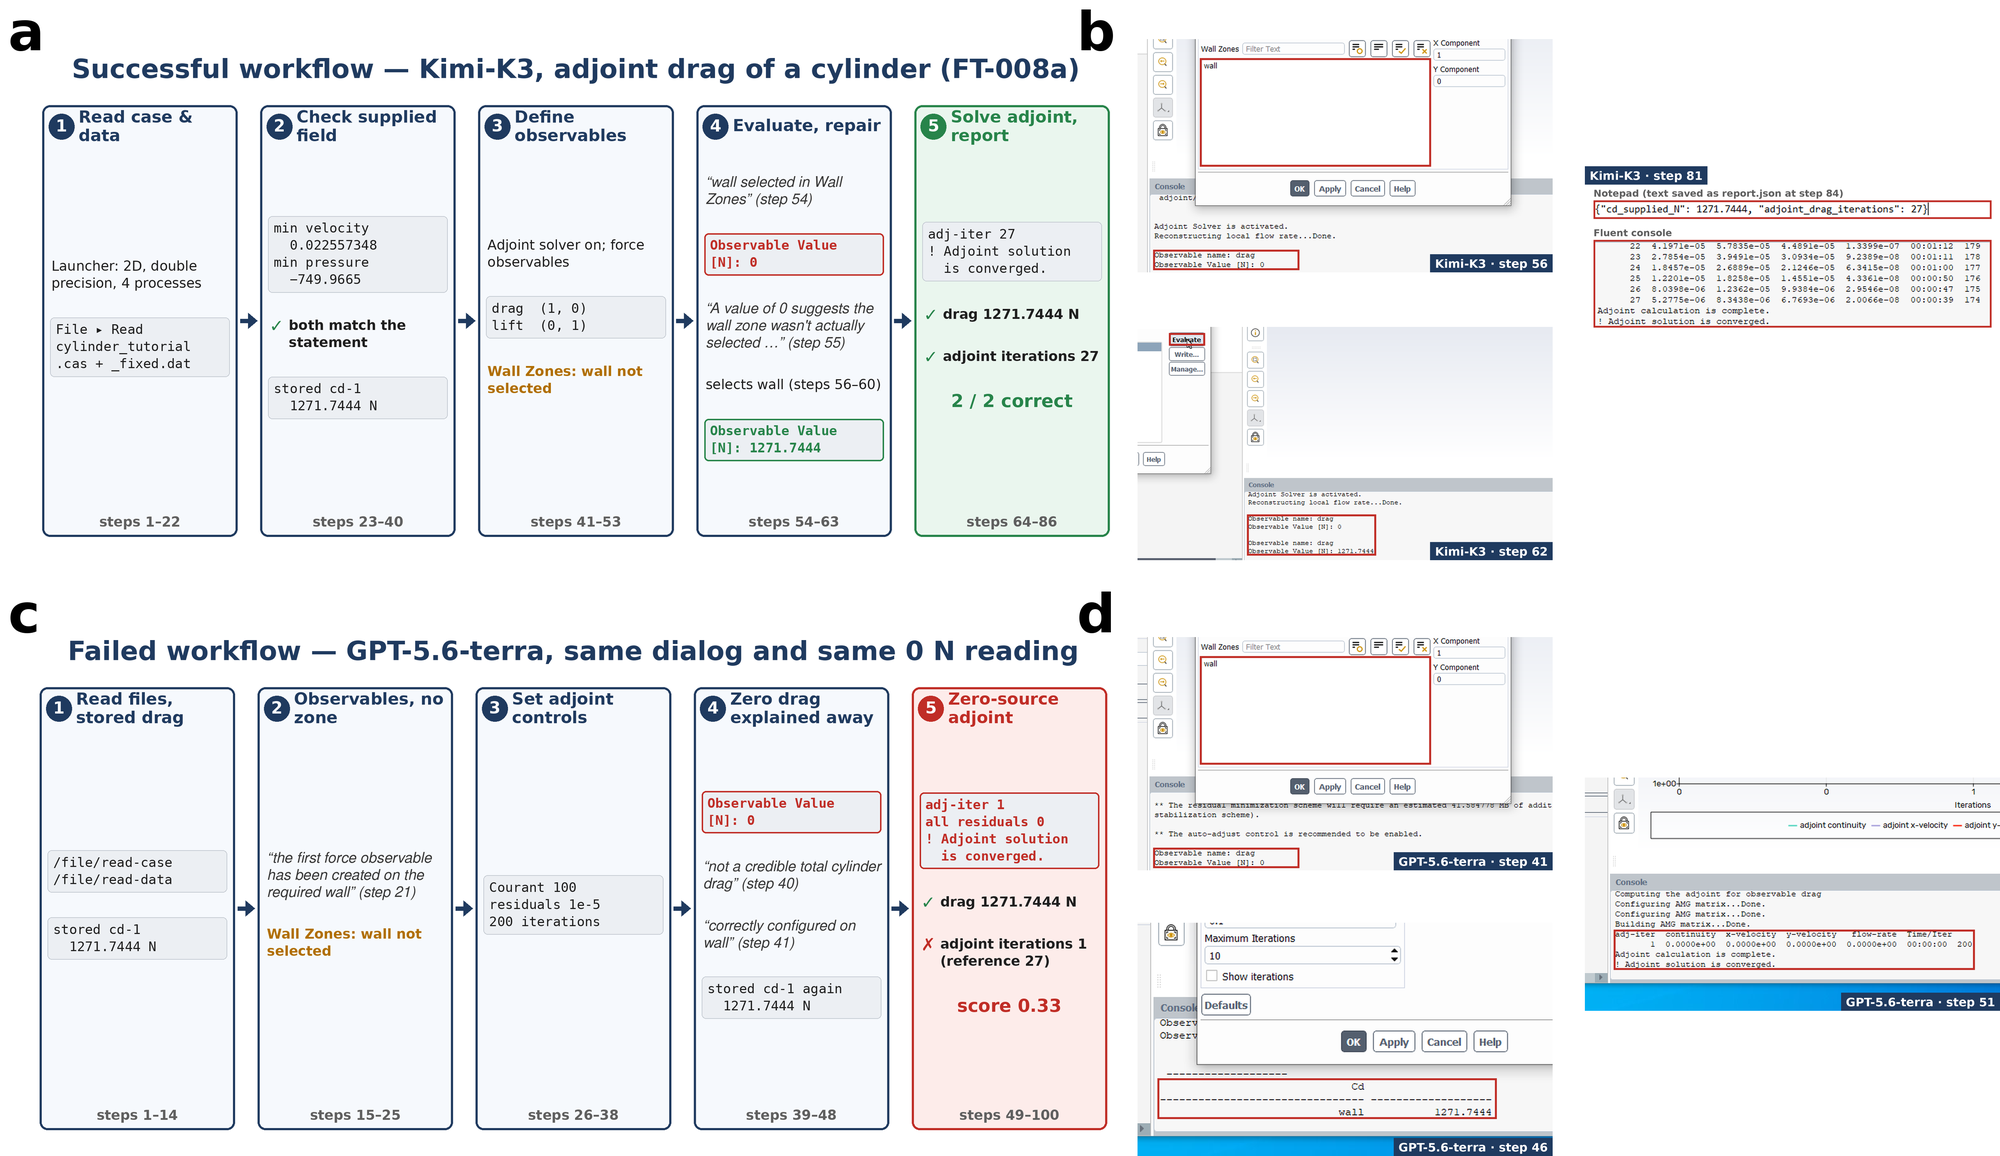
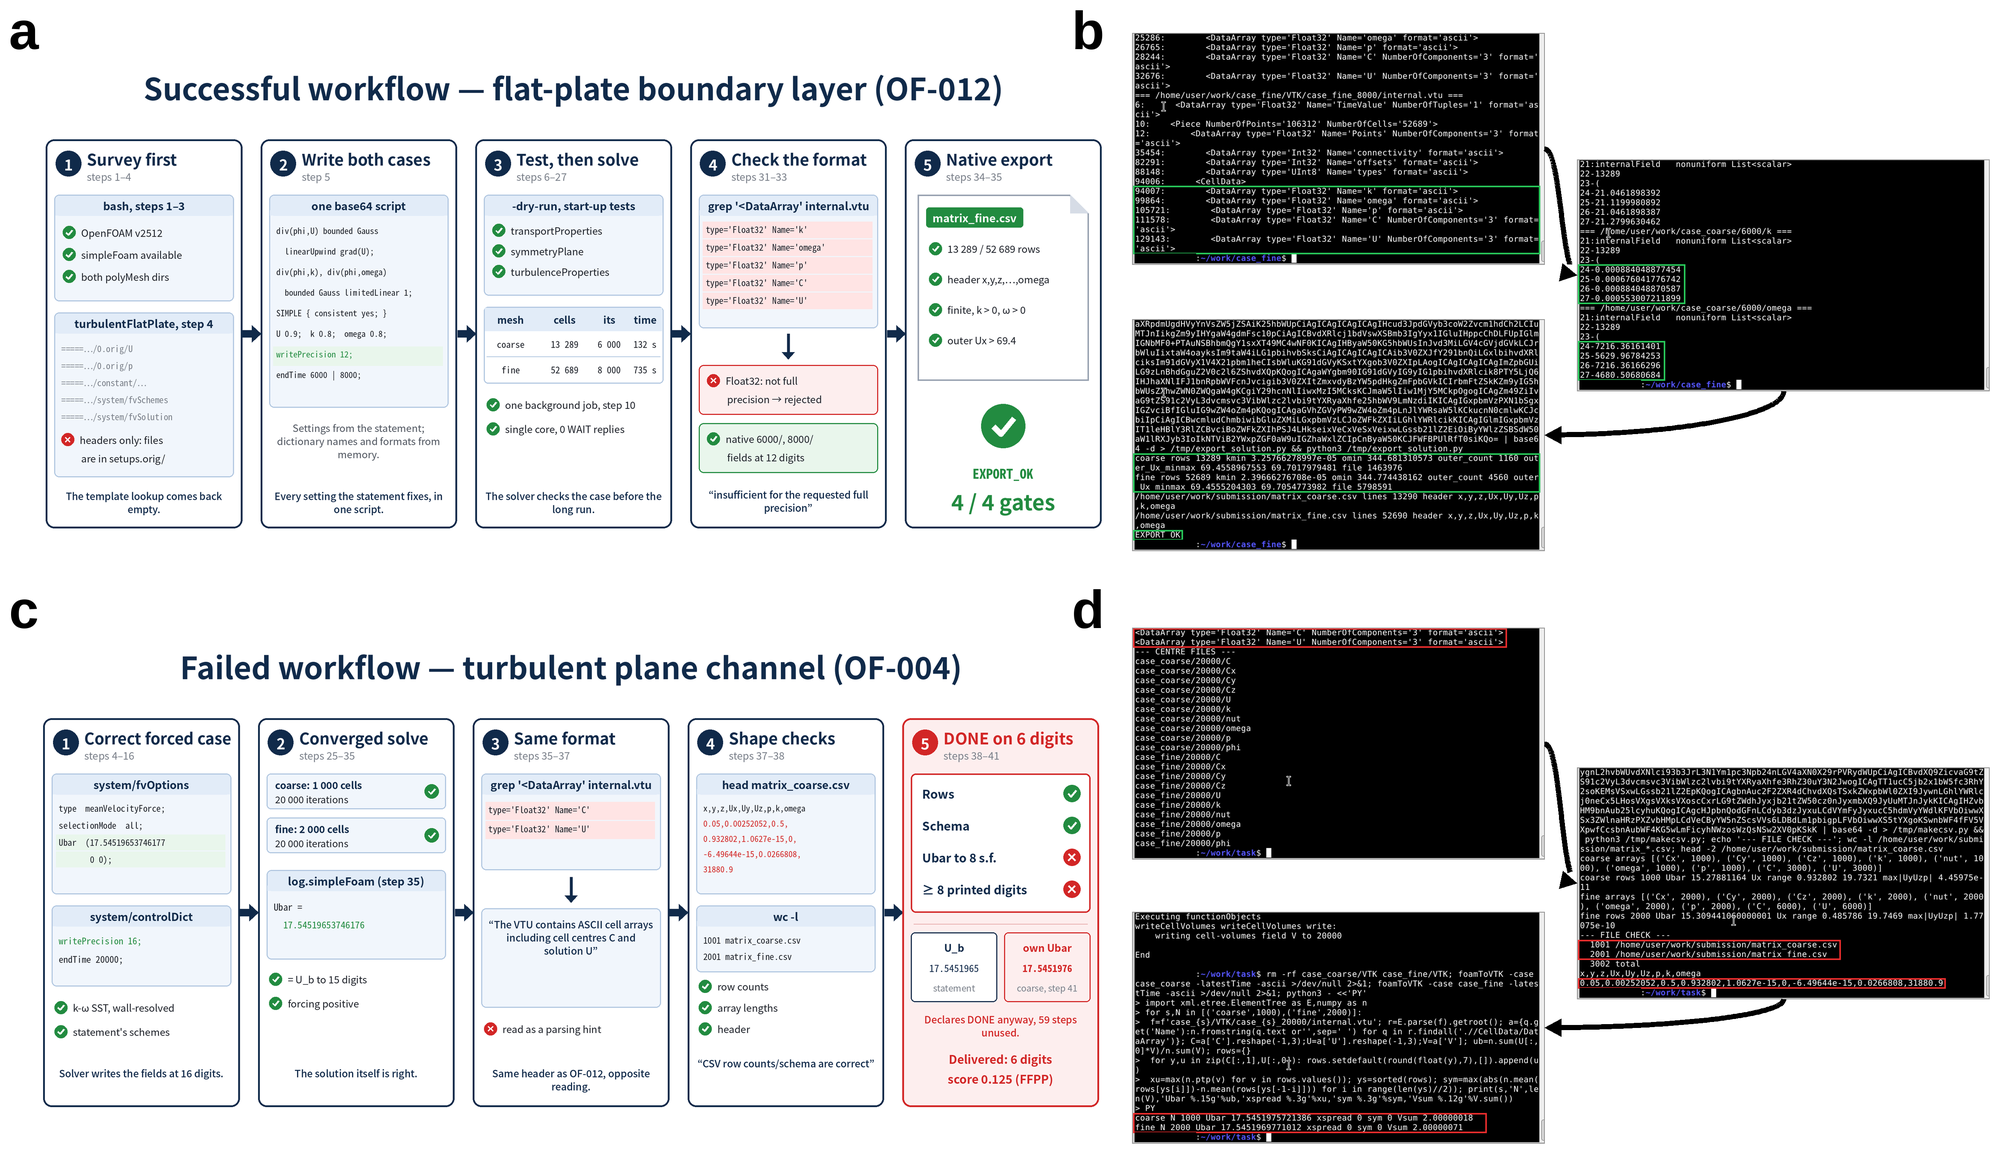
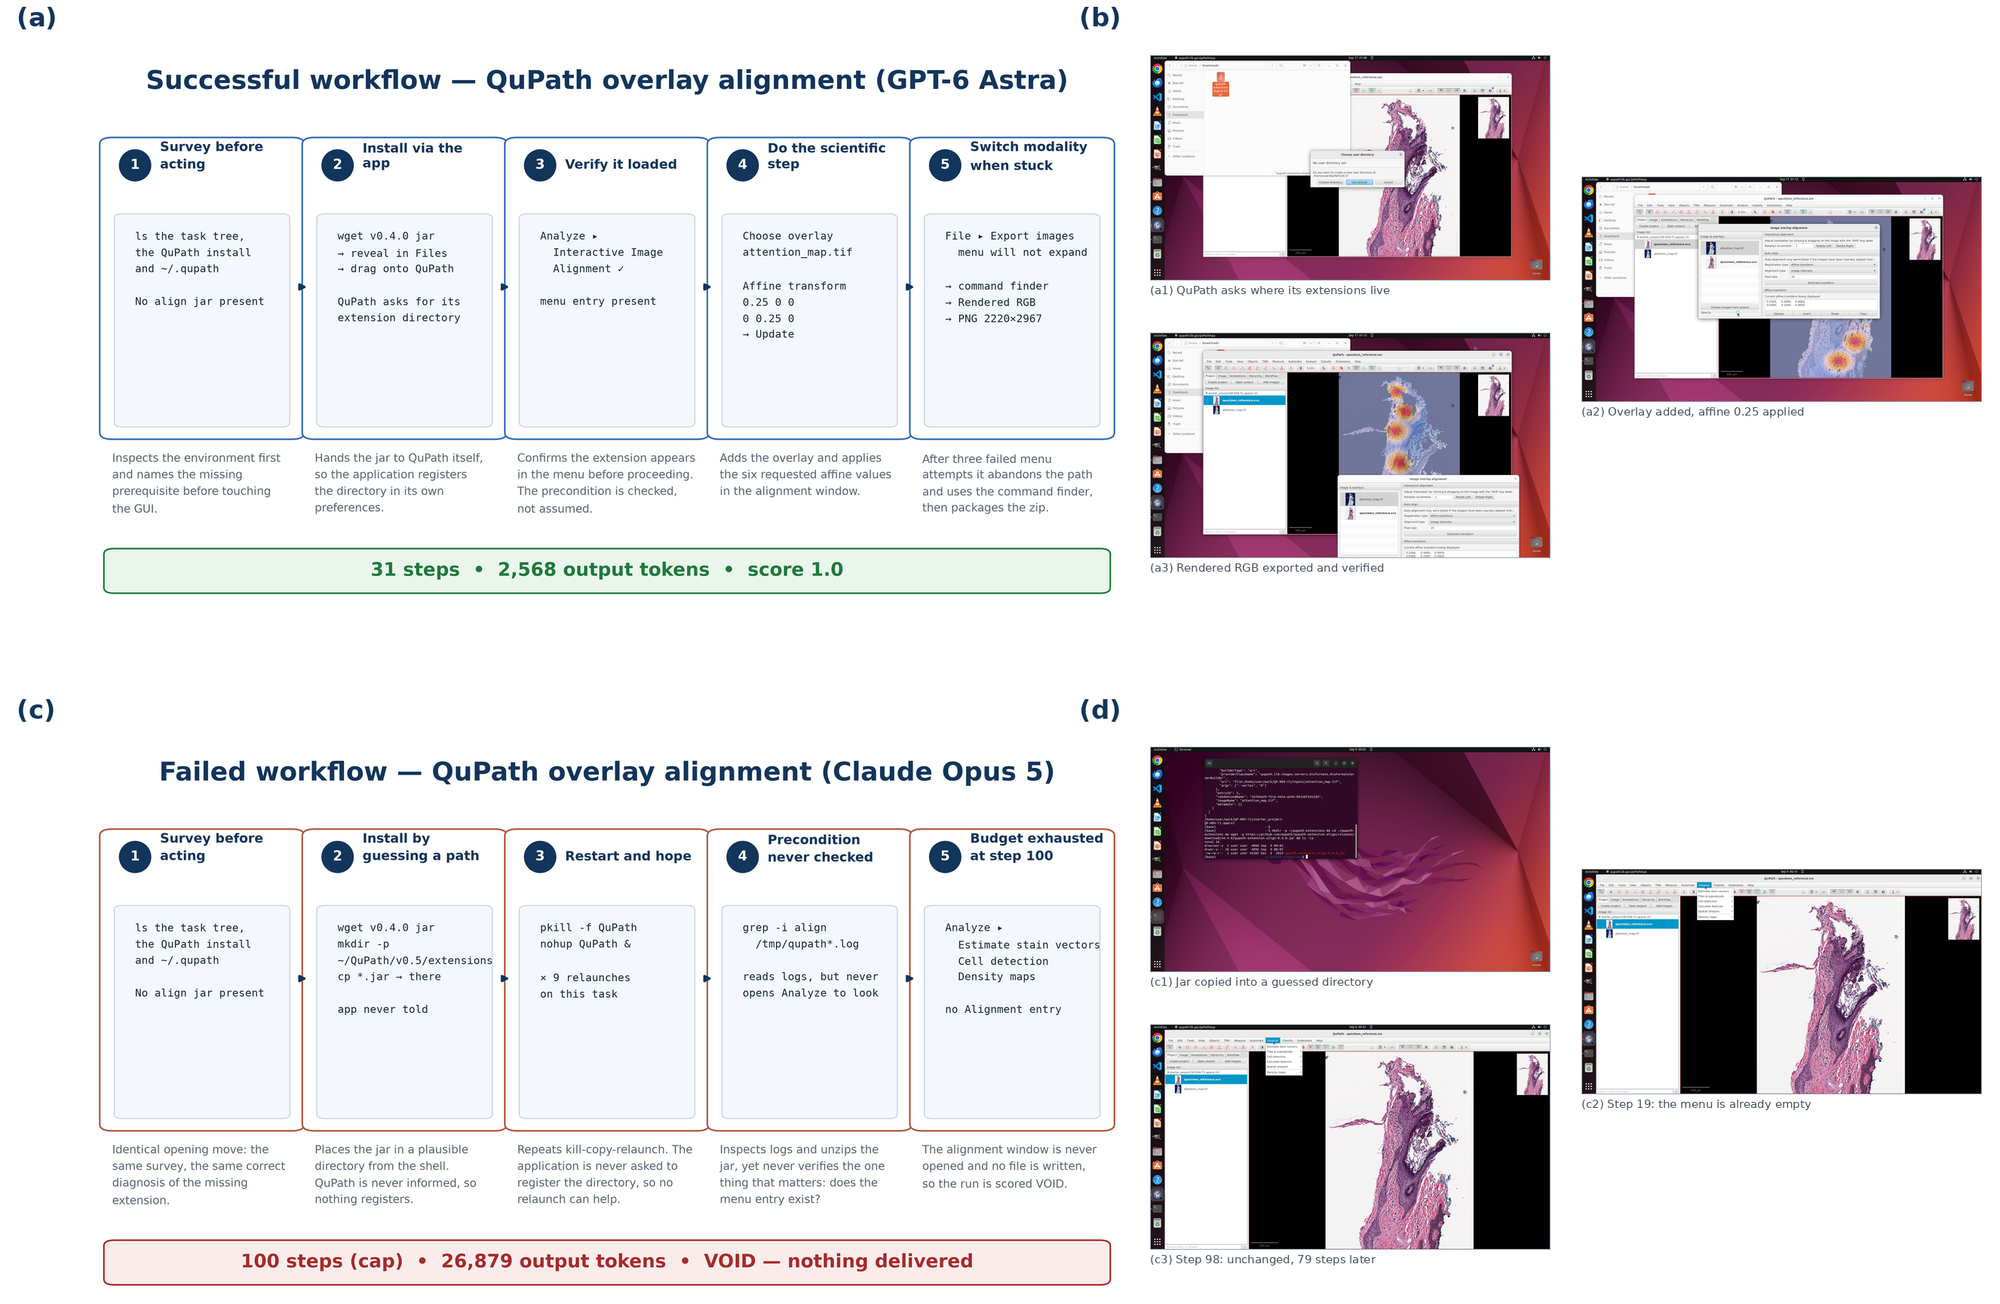
10 case studies from the paper, one per application. Each compares runs on the same or a closely related task, shows the paper's figure for it and names what separated the outcomes. The first is the case study of the main text; the others come from the appendix.

Chemistry · Medicinal and natural-product chemistry · PDF/image viewer + terminal (pdftotext, RDKit, Open Babel)

Checks That Share One Assumption

TasksLenacapavir SAR table extraction; Archangiumide structure reconstruction · Main text

  • SuccessClaude Opus 5Lenacapavir SAR: 17/17 rows correct, score 1.0, 70 steps
  • FailureClaude Opus 5Archangiumide (unreported run; the scored run reached 1.0 in 43 steps): stereochemistry and InChIKey wrong, graded 0.25, 68 steps
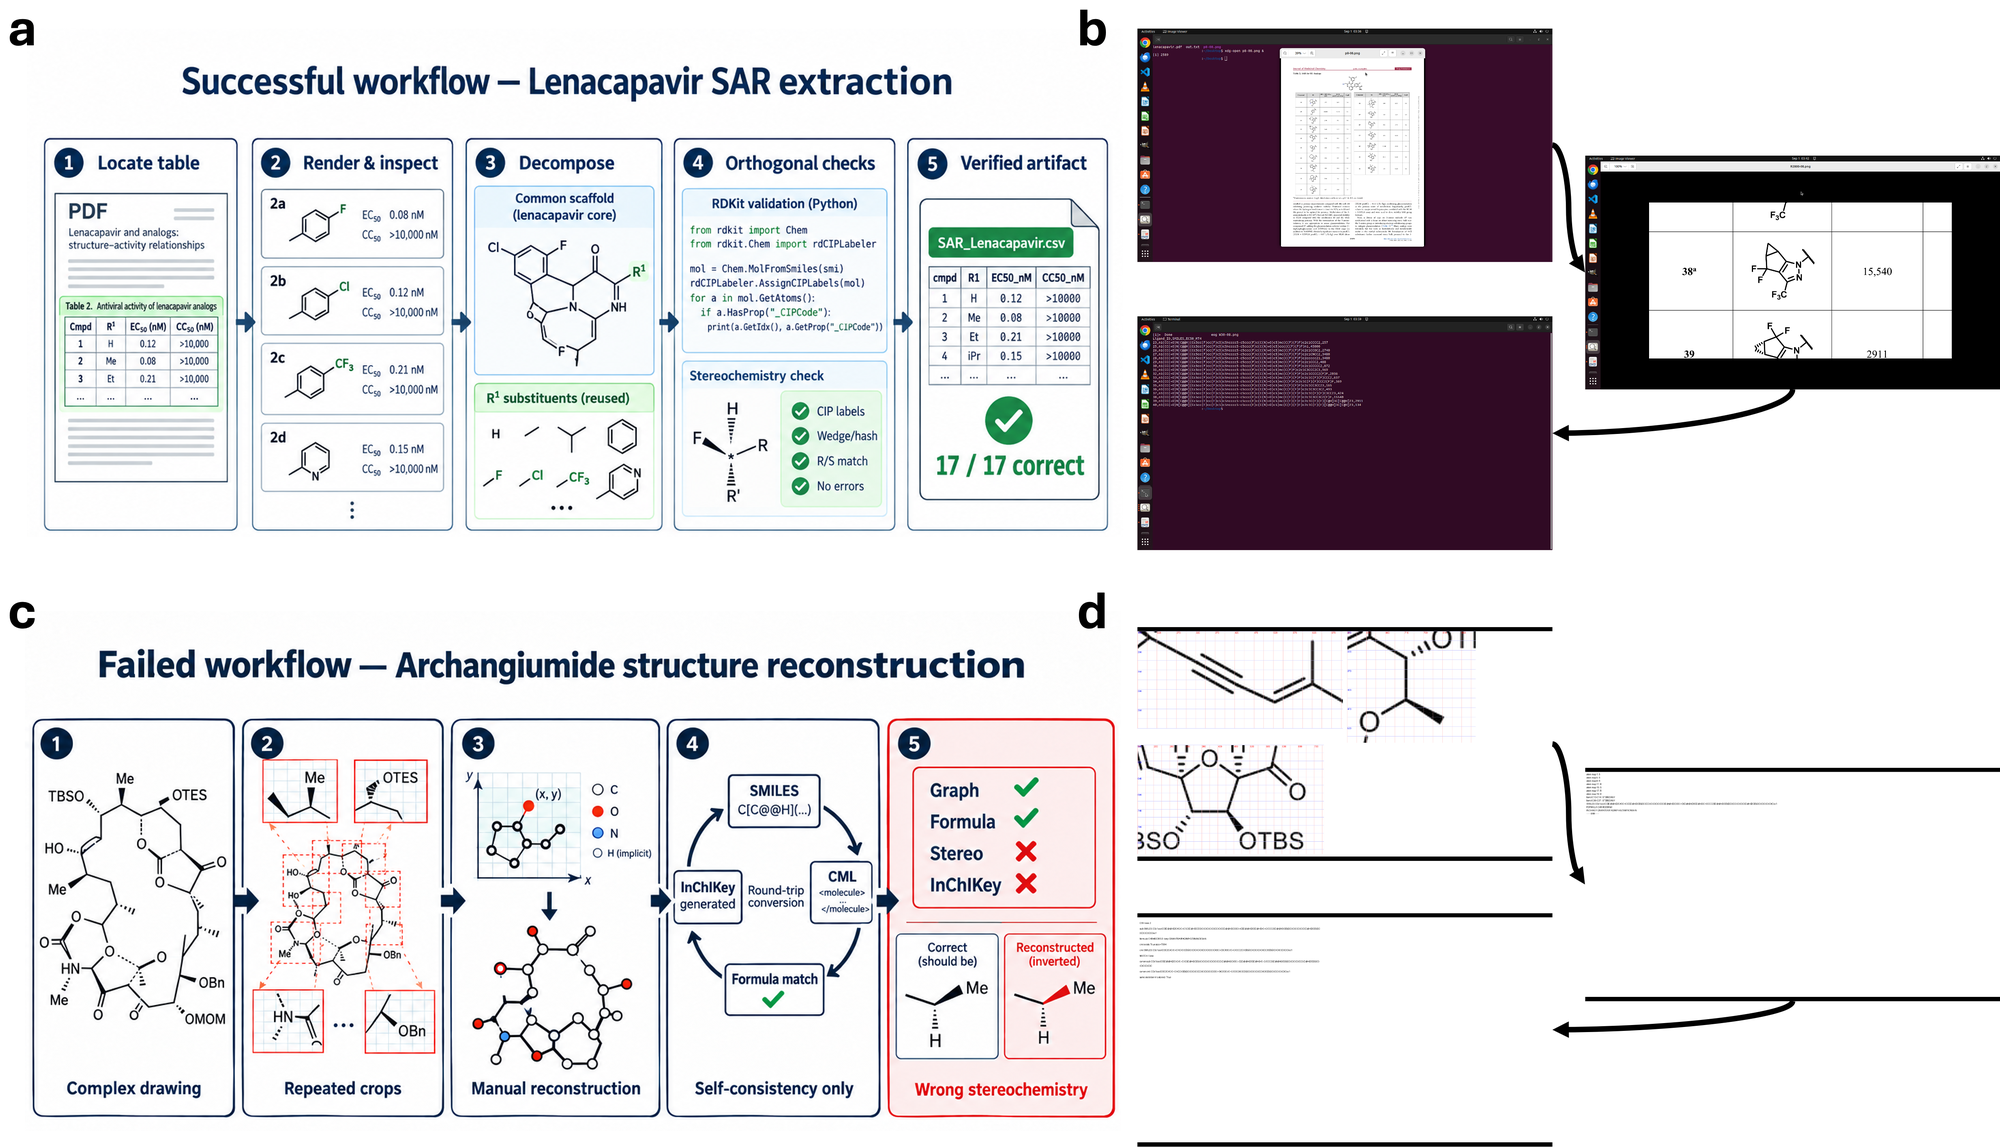
Two five-stage workflow diagrams with raw trajectory frames: the successful Lenacapavir SAR extraction (locate table, render and inspect, decompose, orthogonal checks, 17/17 correct) and a failed, unreported Archangiumide reconstruction (complex drawing, repeated crops, manual reconstruction, self-consistency only, wrong stereochemistry).
Contrasting Claude Opus 5 chemistry workflows with representative raw trajectory frames beside each workflow diagram. (a) and (b): the successful Lenacapavir run moves from source-table localization to focused stereochemical inspection and final validation of the complete 17-row CSV. (c) and (d): a failed, unreported Archangiumide run (the scored run reached 1.0) converts coordinate-guided reconstruction into a chemically valid, internally consistent structure, yet its own round-trip check still reveals a stereochemical mismatch. The decisive difference is independent source-grounded validation rather than trajectory length or the number of checks.

Summary

Two Claude Opus 5 chemistry runs with nearly identical horizons end with opposite outcomes. On the Lenacapavir SAR task the run located Table 2 with pdftotext, rendered the page at 200–1200 dpi, separated the shared scaffold from the 17 variable R¹ substituents, and before writing the CSV cross-checked the assay column and footnotes, parsed every SMILES with RDKit and verified the intended CIP assignments: all 17 rows were correct (score 1.0 after 70 steps). On an unreported Archangiumide run (the scored run reached 1.0 in 43 steps) it spent most of 68 steps on enlarged crops, coordinate grids and hand-mapped coordinates, then validated its own hypothesis by round-tripping the SMILES through CML/Open Babel and recomputing the formula and InChIKey; the graph and formula were correct but the stereochemistry and InChIKey were wrong (graded 0.25), because every downstream conversion reproduced the same inverted stereocenter.

Takeaway

Long trajectories and many validation actions are insufficient when all checks share one latent assumption; orthogonal validation against the source, not self-consistency, separates the two runs.

Failures and Successes, Side by Side

Five tasks, five applications. For each, one run that earned full credit and one that did not, from the same task package, the same starting state and the same grader. Frames are the screenshots the model saw at that step; captions quote the model's own plan where it wrote one.

QuPath 0.5.1 · Medicine · Digital pathology · Task QP_001_T1-2

One intermediate-size nucleus ellipse inside ROI-A

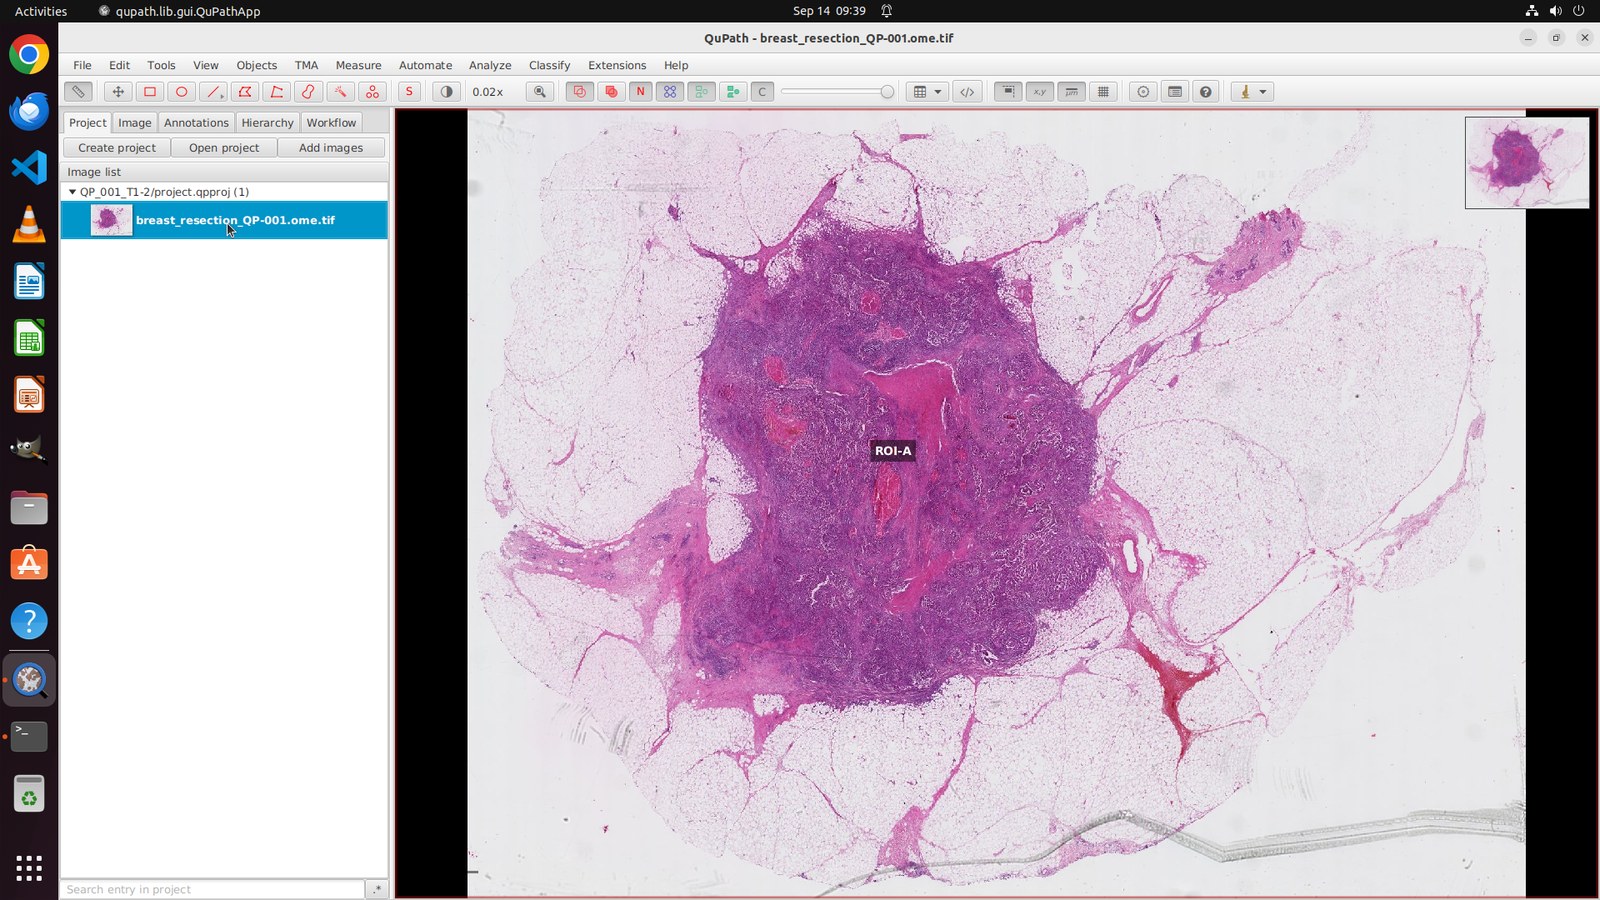
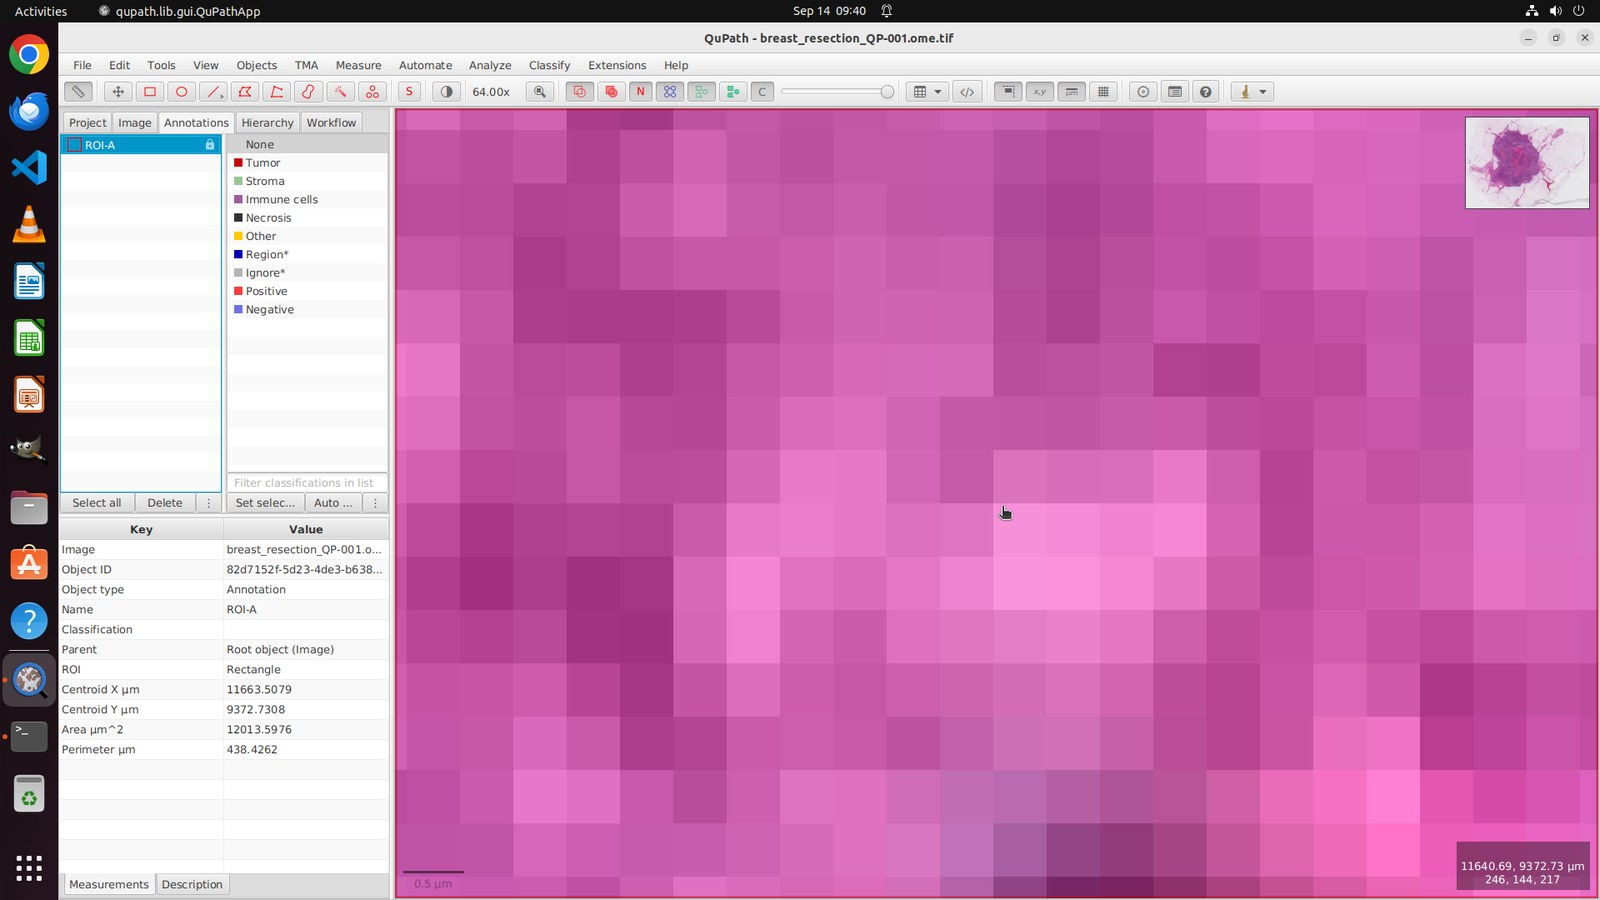
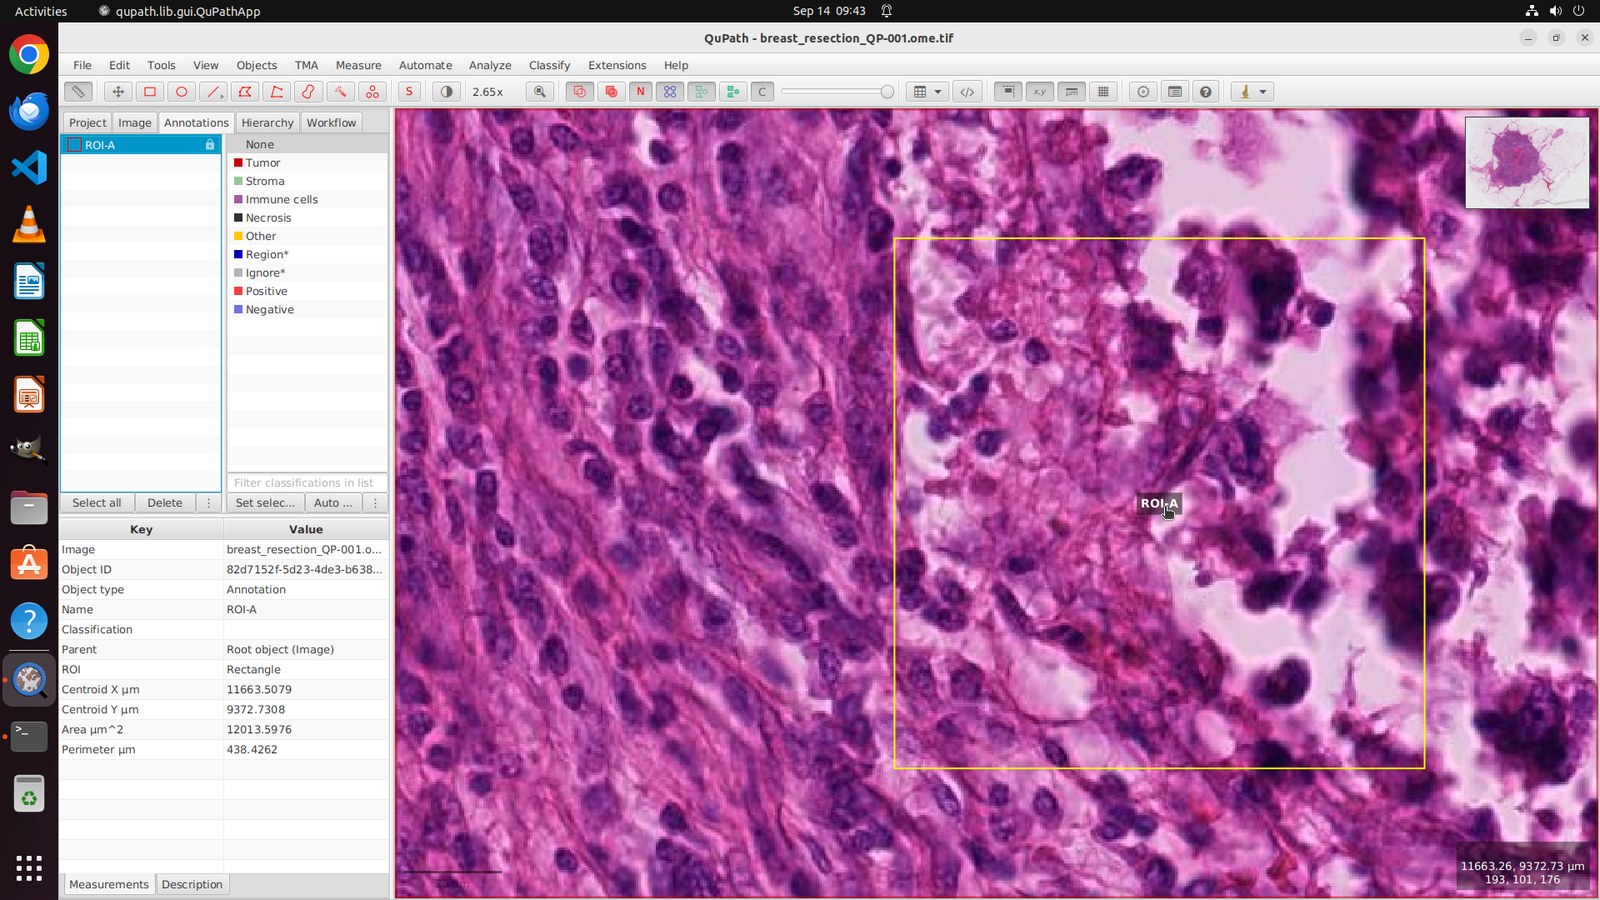
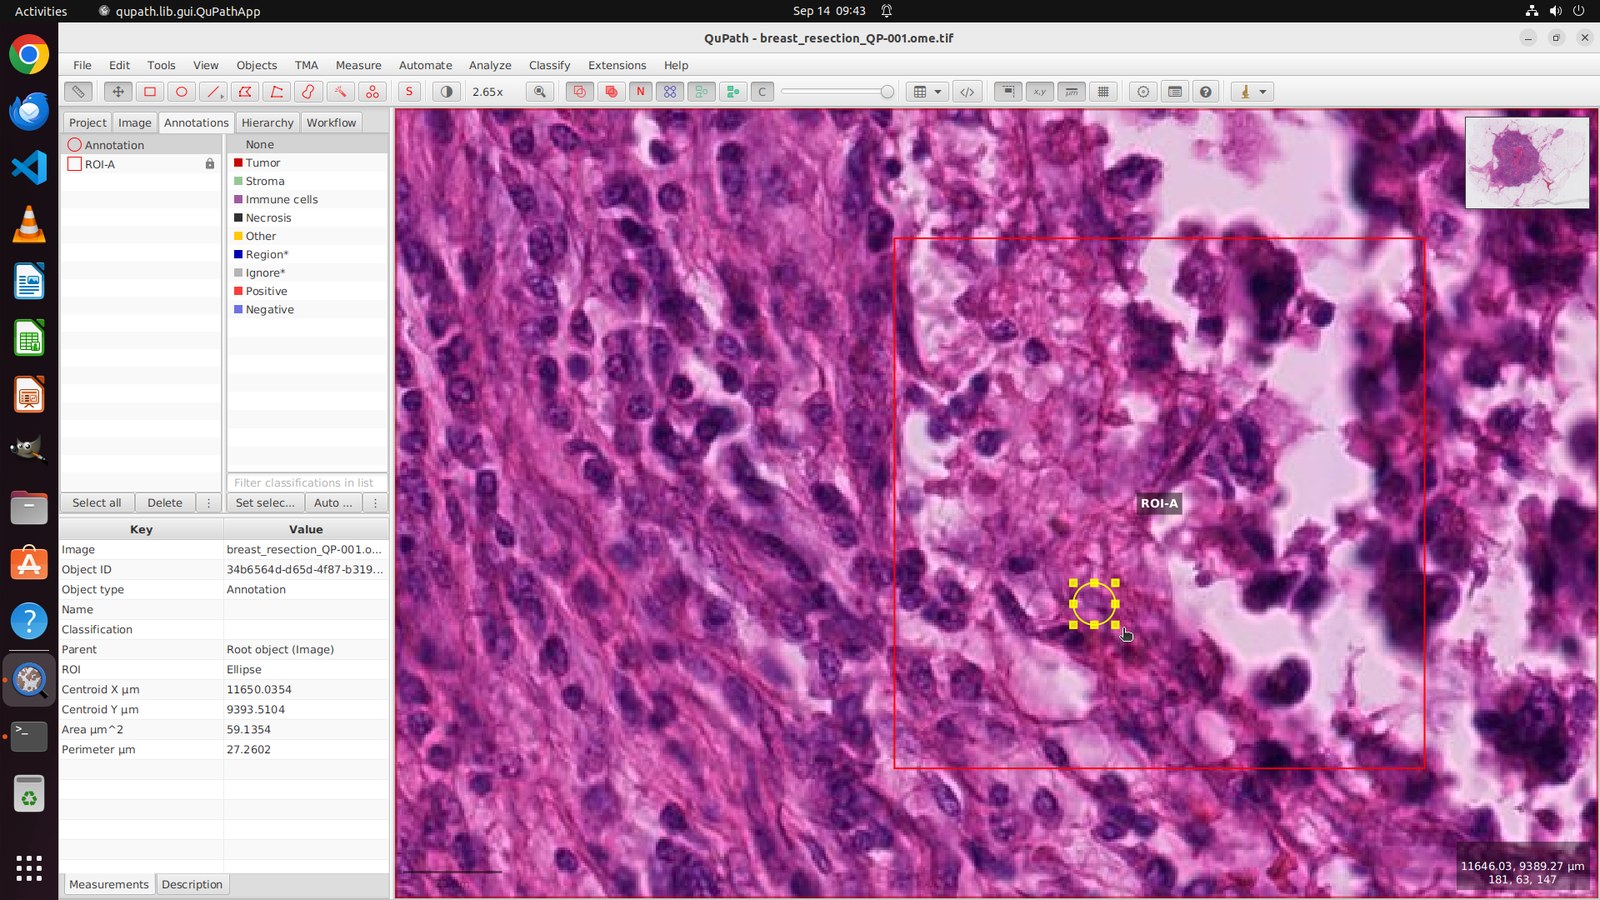
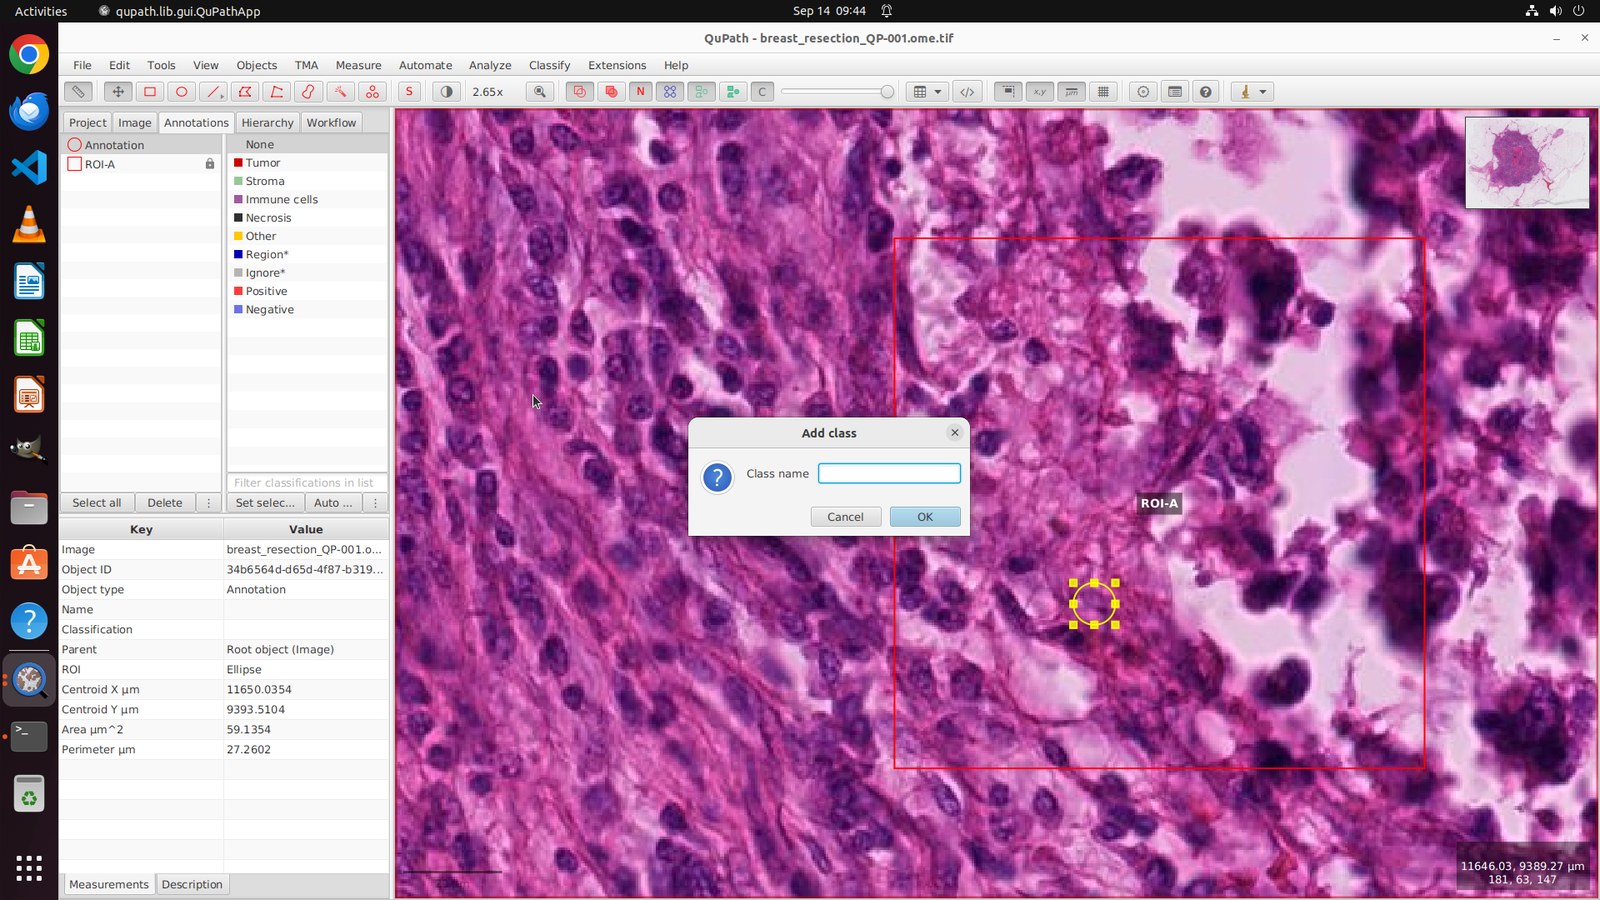
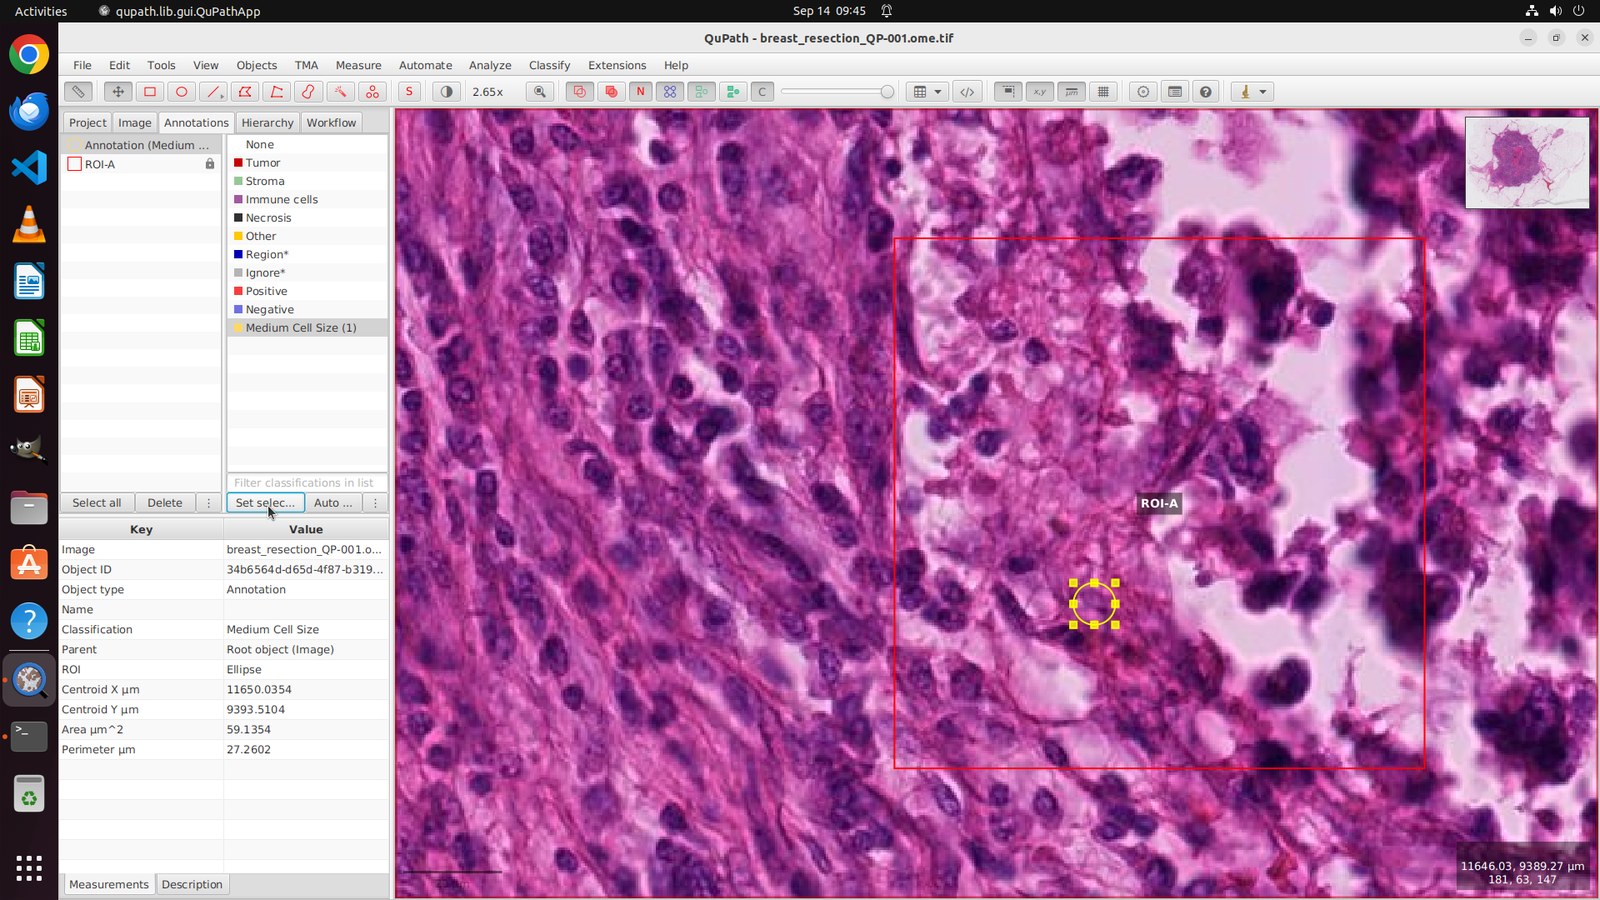
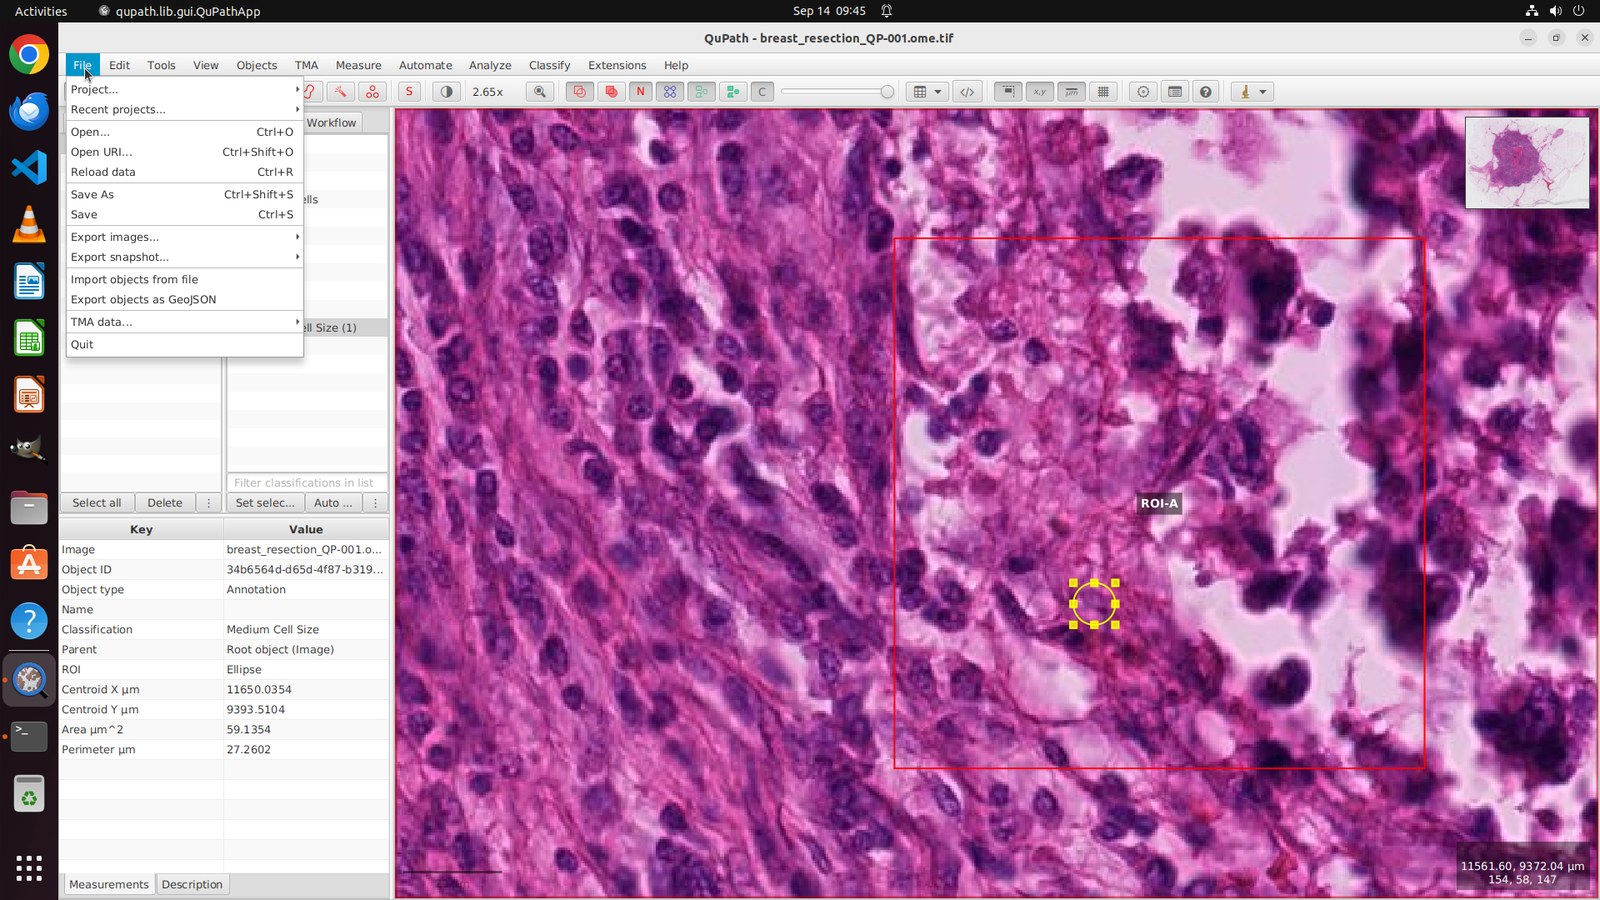
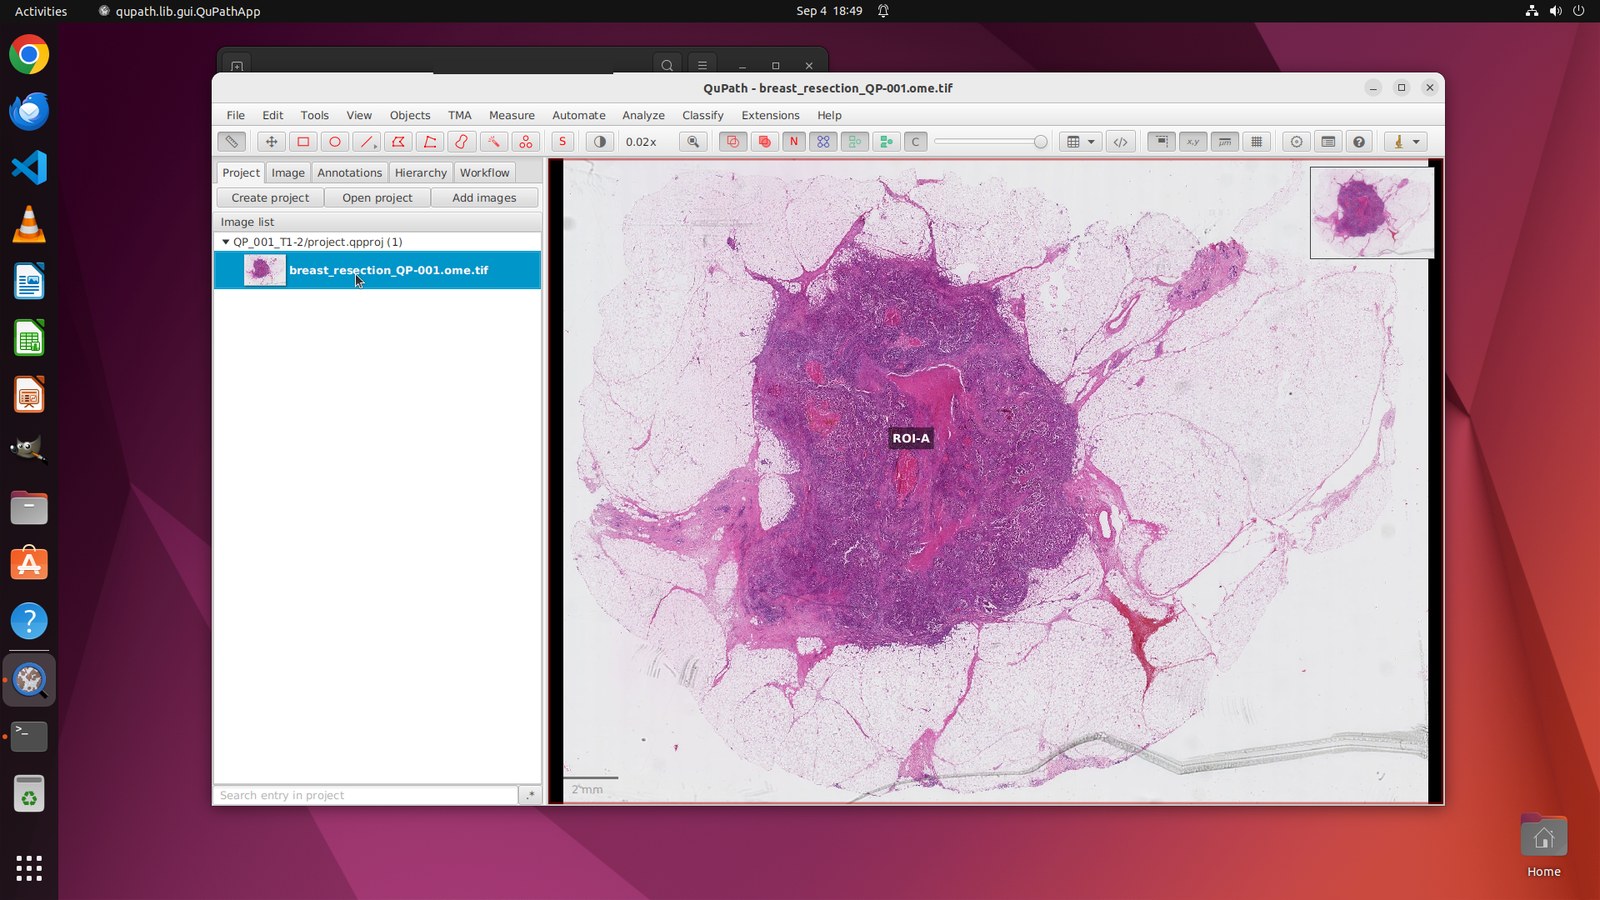
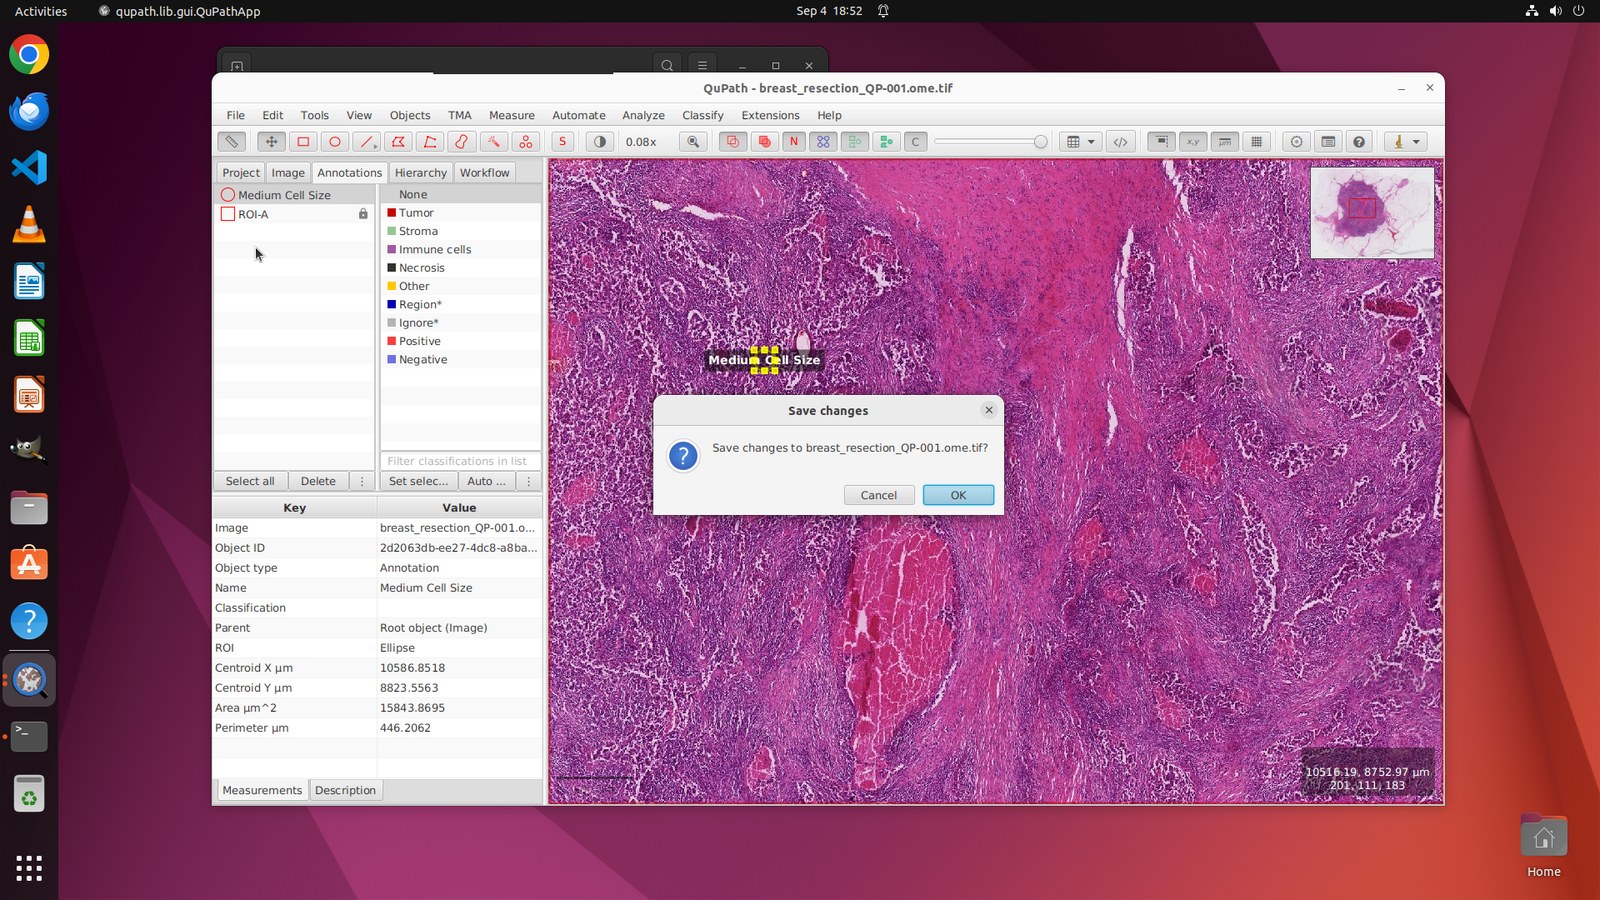
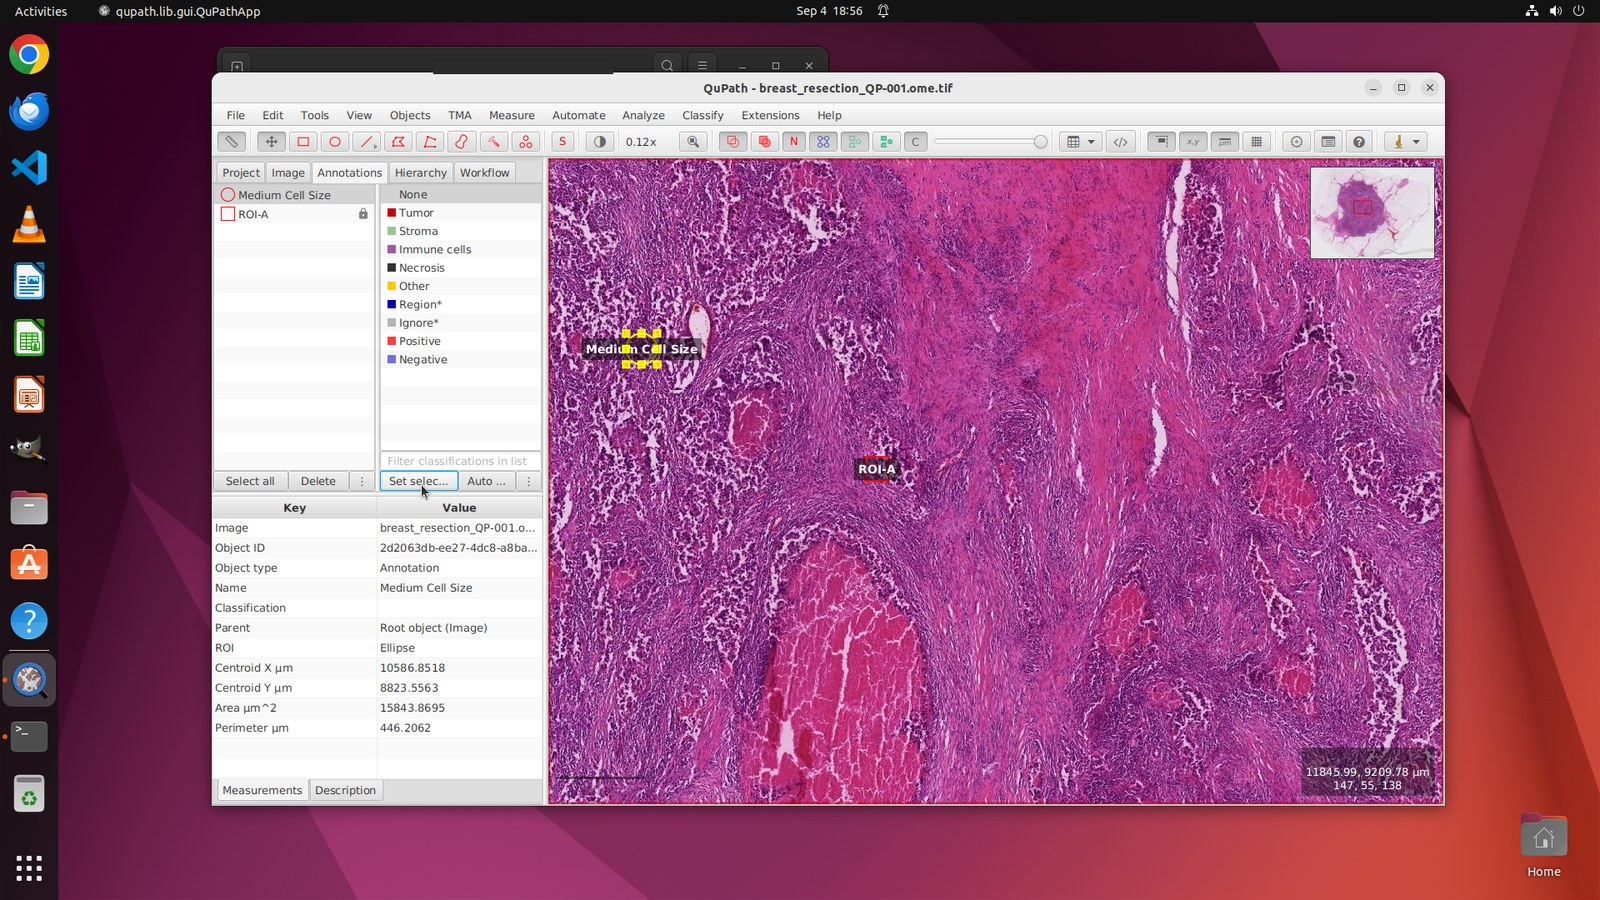
TaskA breast-resection whole-slide image is open in a QuPath project that has one rectangular annotation, ROI-A. The agent inspects the clearly separable nuclei in ROI-A and draws exactly one roughly circular ellipse of intermediate nuclear size, completely inside ROI-A. It then classifies the ellipse as “Medium Cell Size”, leaves ROI-A unchanged and saves the project. The grader reads the saved project, checks that ROI-A is unchanged and that there is exactly one ellipse, then checks the ellipse's class, shape, position and diameter.

Successful run

Claude Fable 5.1

PASSScore 1.00

27 of 100 steps · GUI share 96%

One 19 × 19 px ellipse, classified Medium Cell Size, inside ROI-A (allowed diameter 10.2–27.0 px).

Claude Fable 5.1, screenshot before its action at step 8
Step 8 · 1 / 7Fable first inspects the project files from a terminal and launches QuPath from it (steps 1–4). The slide is now open at 0.02×, with ROI-A labeled in the middle of the tumor.
1 / 7

Model narrationShort plans before most actions (steps 21, 22 and 26 are code only).

Failed run

GPT-5.6 luna

FAIL · wrong contentScore 0.00

37 of 100 steps · GUI share 72%

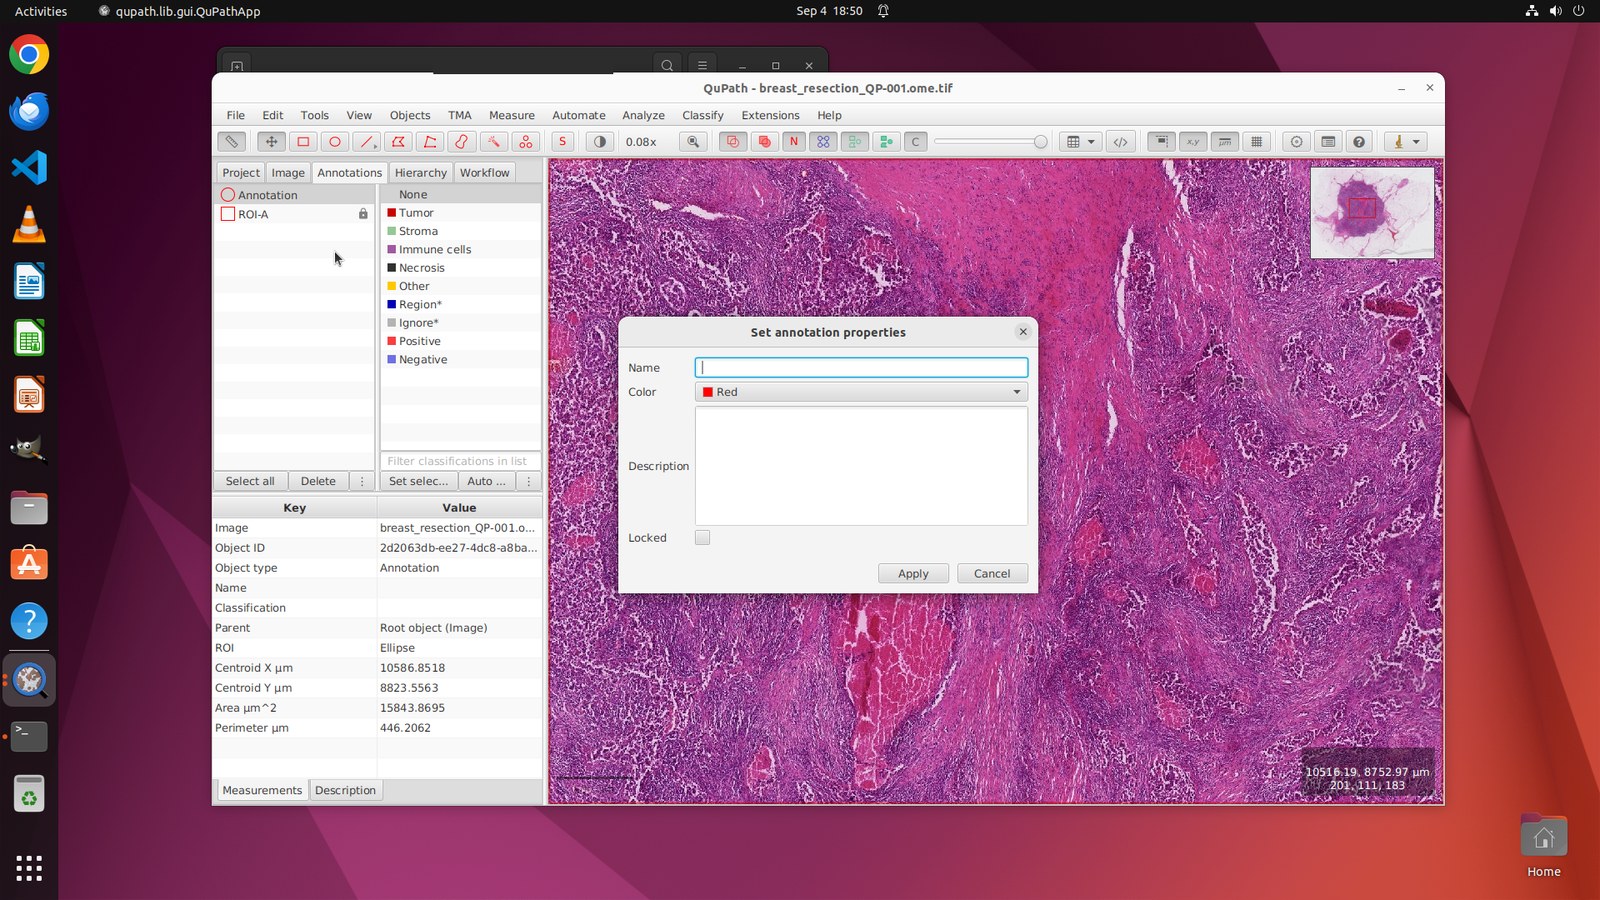
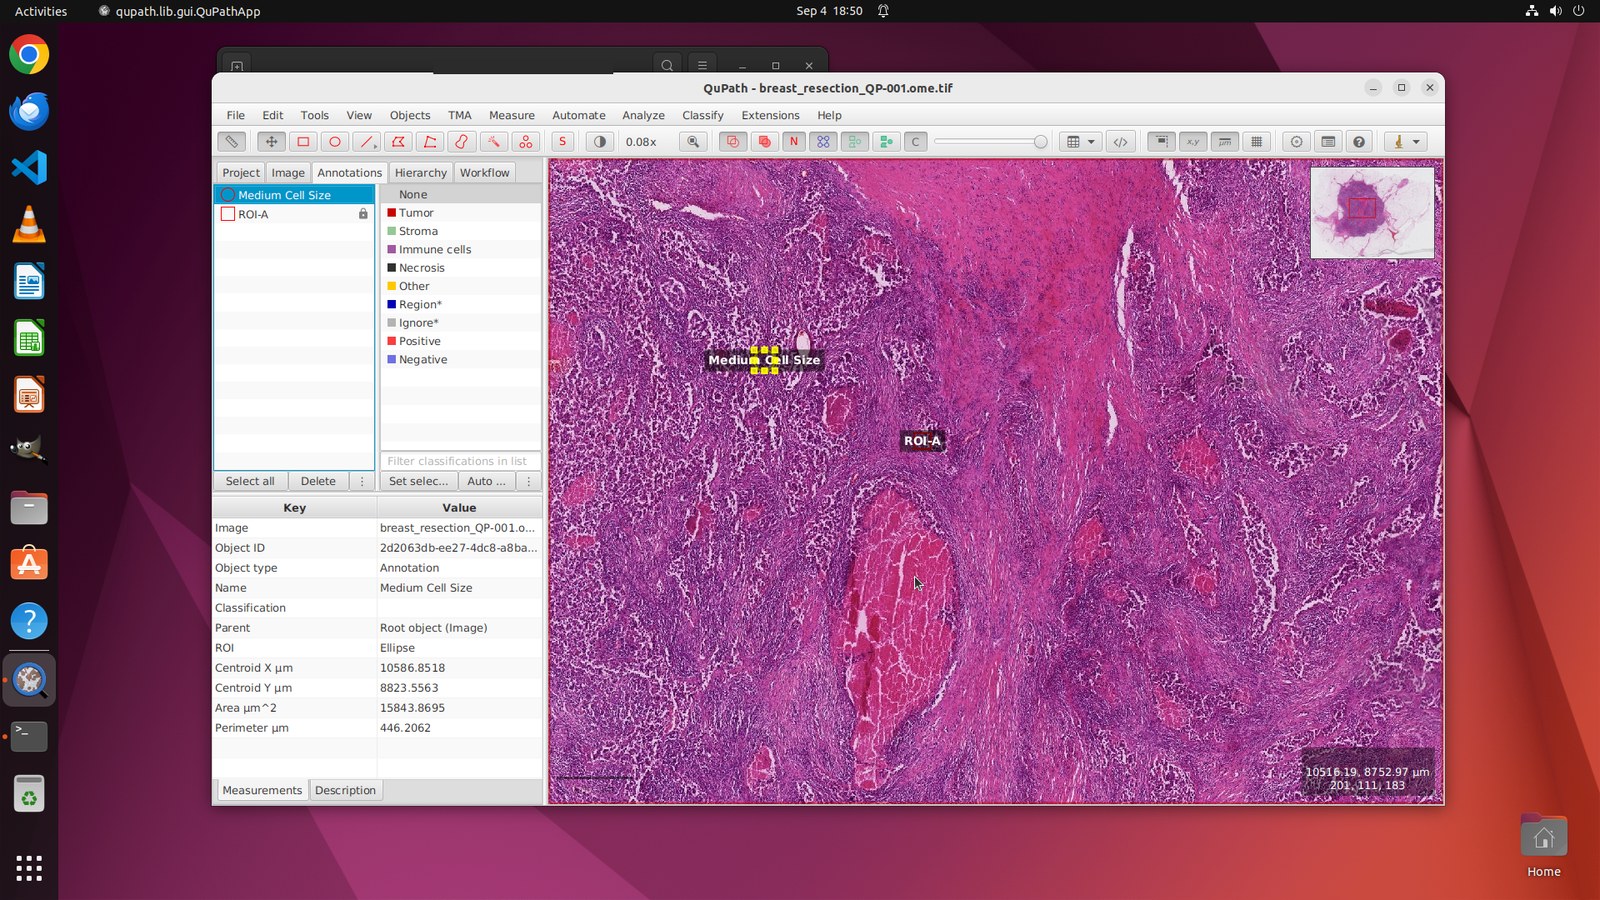
Grader: “'Medium Cell Size' is not assigned to an EllipseROI”.

GPT-5.6 luna, screenshot before its action at step 7
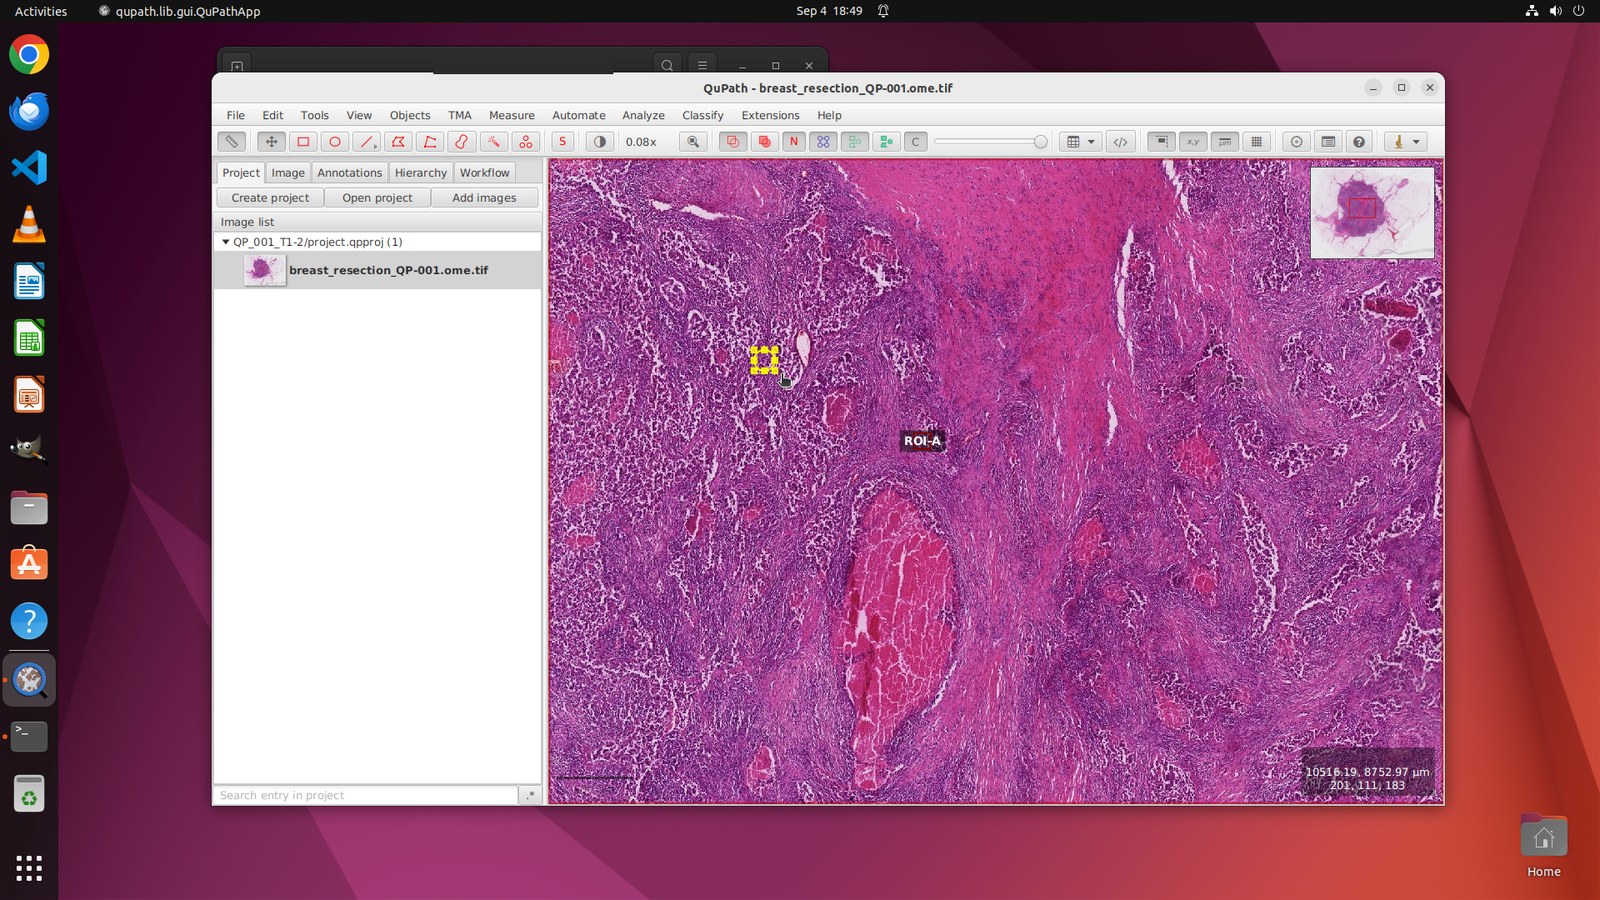
Step 7 · 1 / 6Luna launches QuPath from a terminal and opens the project through the file chooser (steps 1–6). The slide appears at 0.02×, with ROI-A labeled in the center.
1 / 6

Model narrationTwo short code comments (steps 7–8); every other response is code only, so these captions describe the logged actions and the screen.

Analysis

Both runs reach the same QuPath panels and both type the string “Medium Cell Size”; the difference lies in where that string ends up and at what scale the ellipse is drawn. Fable zoomed until all of ROI-A was in view (2.65×) and drew a nucleus-sized 19 × 19-px circle inside it. It created the class with Add class, applied it with Set selected, and confirmed the Classification row before saving. Luna drew at 0.08×, where a 25-pixel screen drag produced a 311 × 311-px ellipse (15,844 µm²), larger than ROI-A (240 × 240 px) and about 1.2 mm away from it. It then wrote the label into the annotation's Name field, never created the class, and kept pressing Set selected with nothing to apply. The grader finds ROI-A unchanged and exactly one ellipse, then stops at the class check: no ellipse carries the classification, so size and position are never scored.

Takeaway

In QuPath a name is not a classification, and a 25-pixel drag at 0.08× is not nucleus-sized. The successful run worked at the scale of the object and read back the exact field the grader checks.

A step is one model call and the action it returned; the frame shown for step N is the screenshot the model saw before that action. GUI share is the fraction of the run's action steps that operate the application GUI. Score is the grader score in [0, 1]; PASS means full credit.

Trajectory Showcase

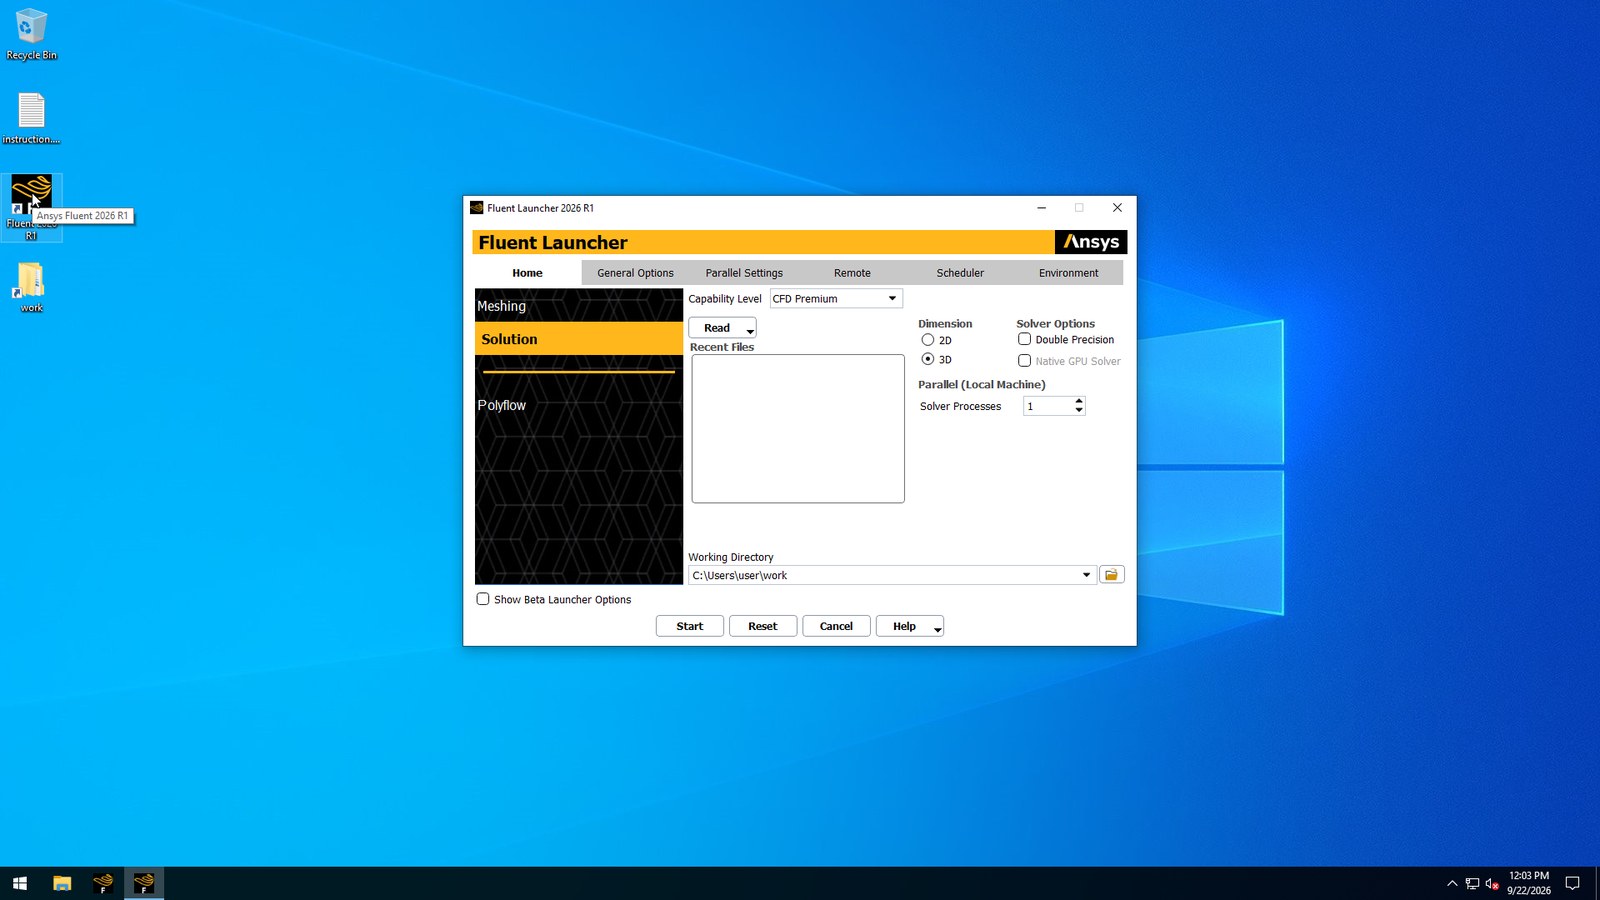
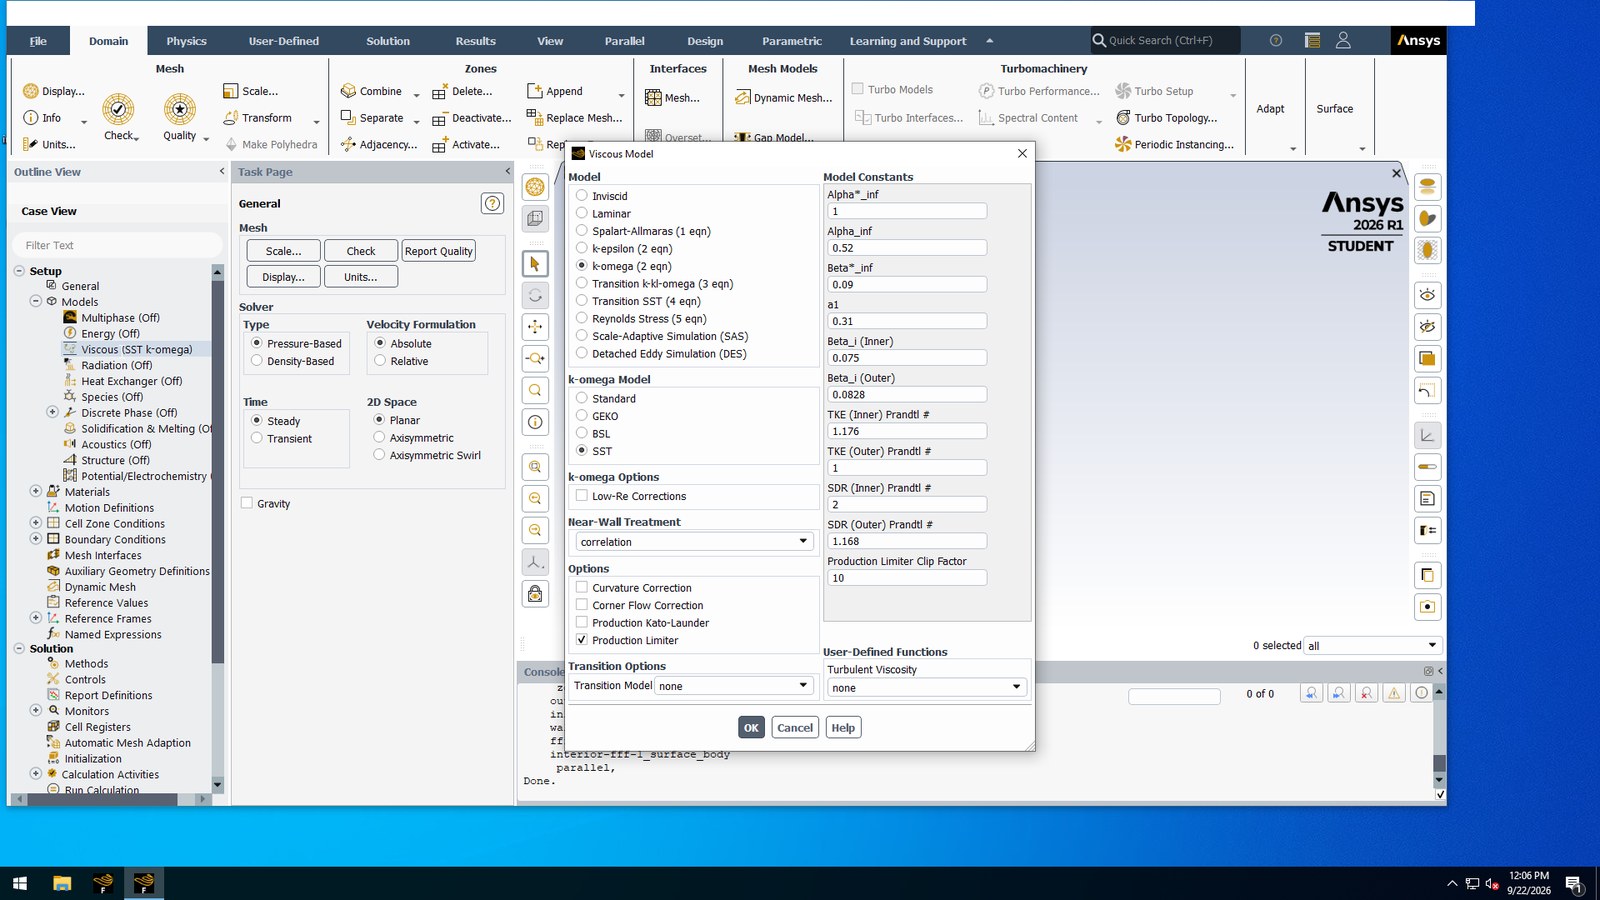
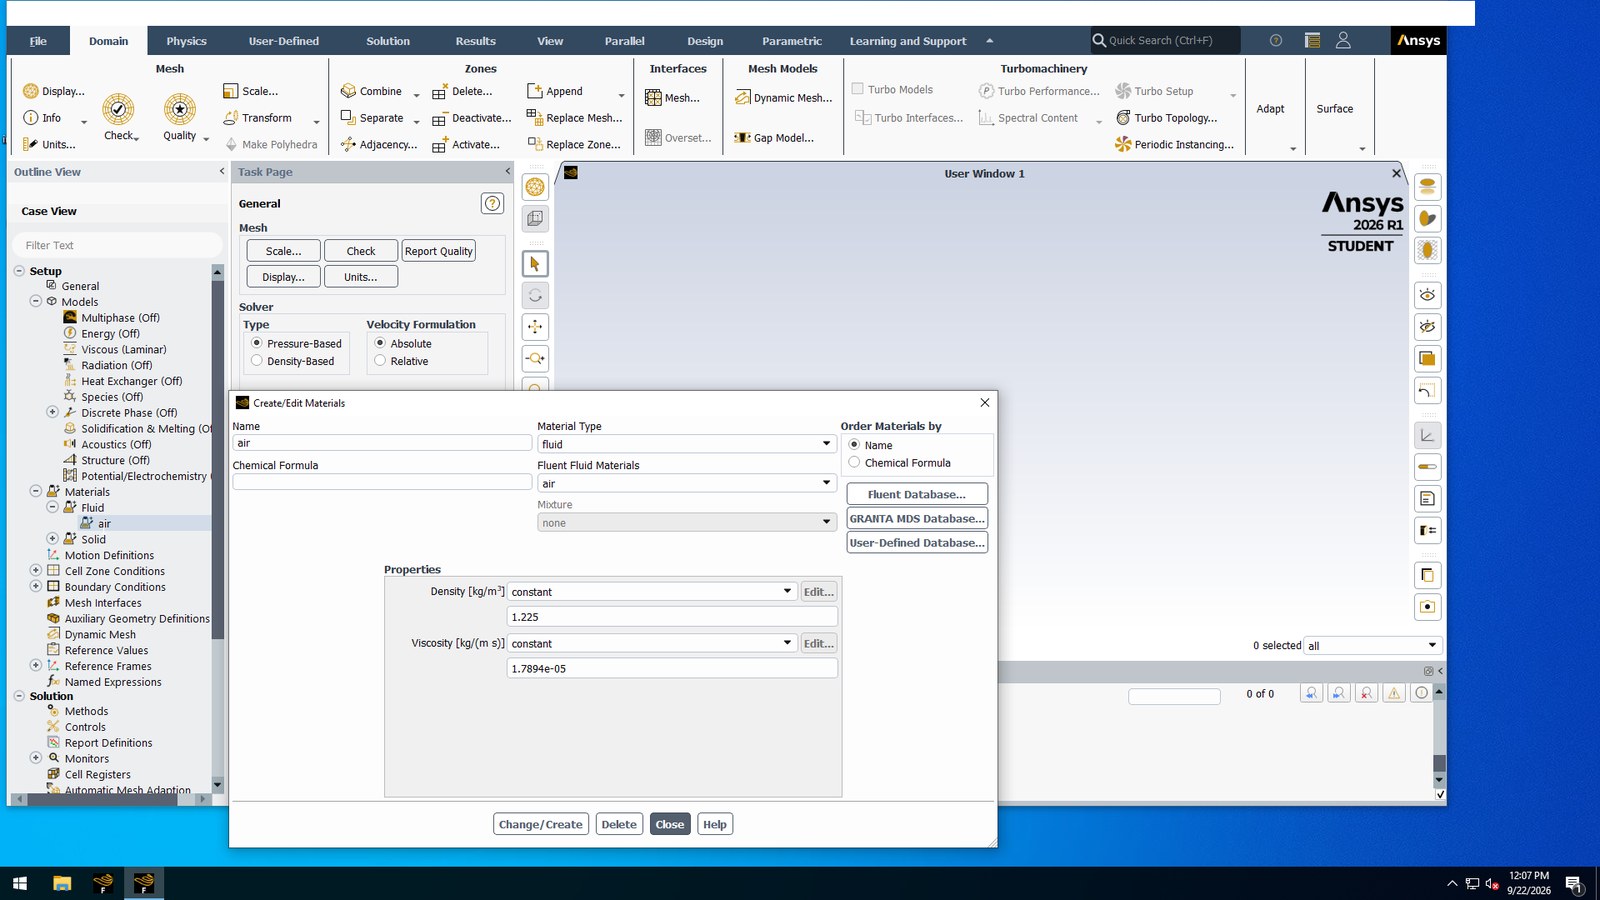
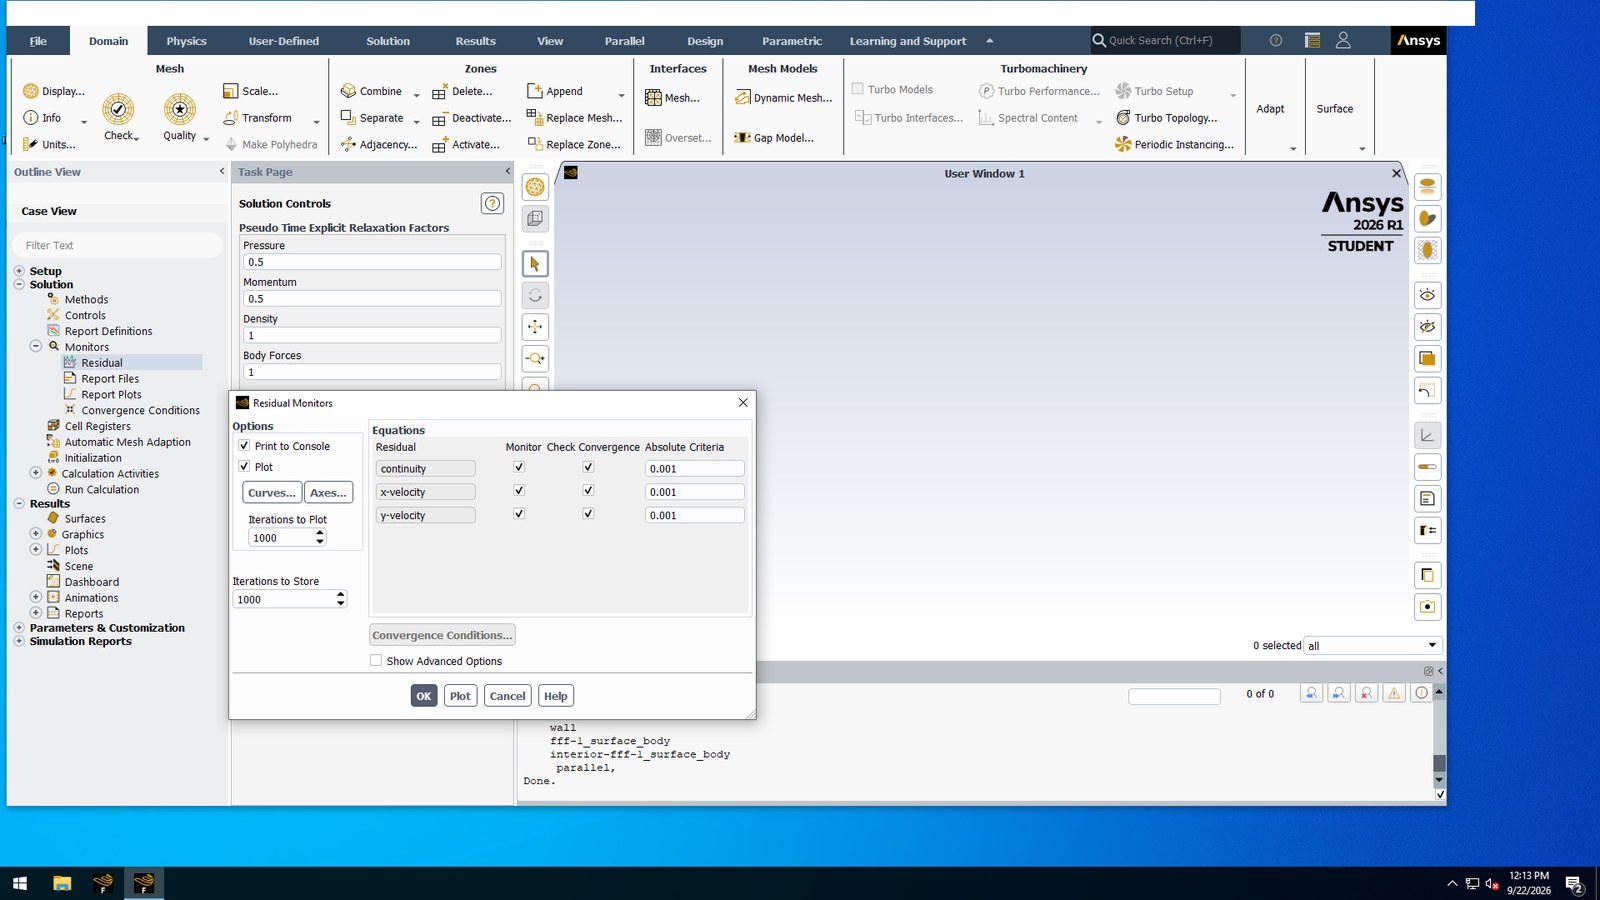
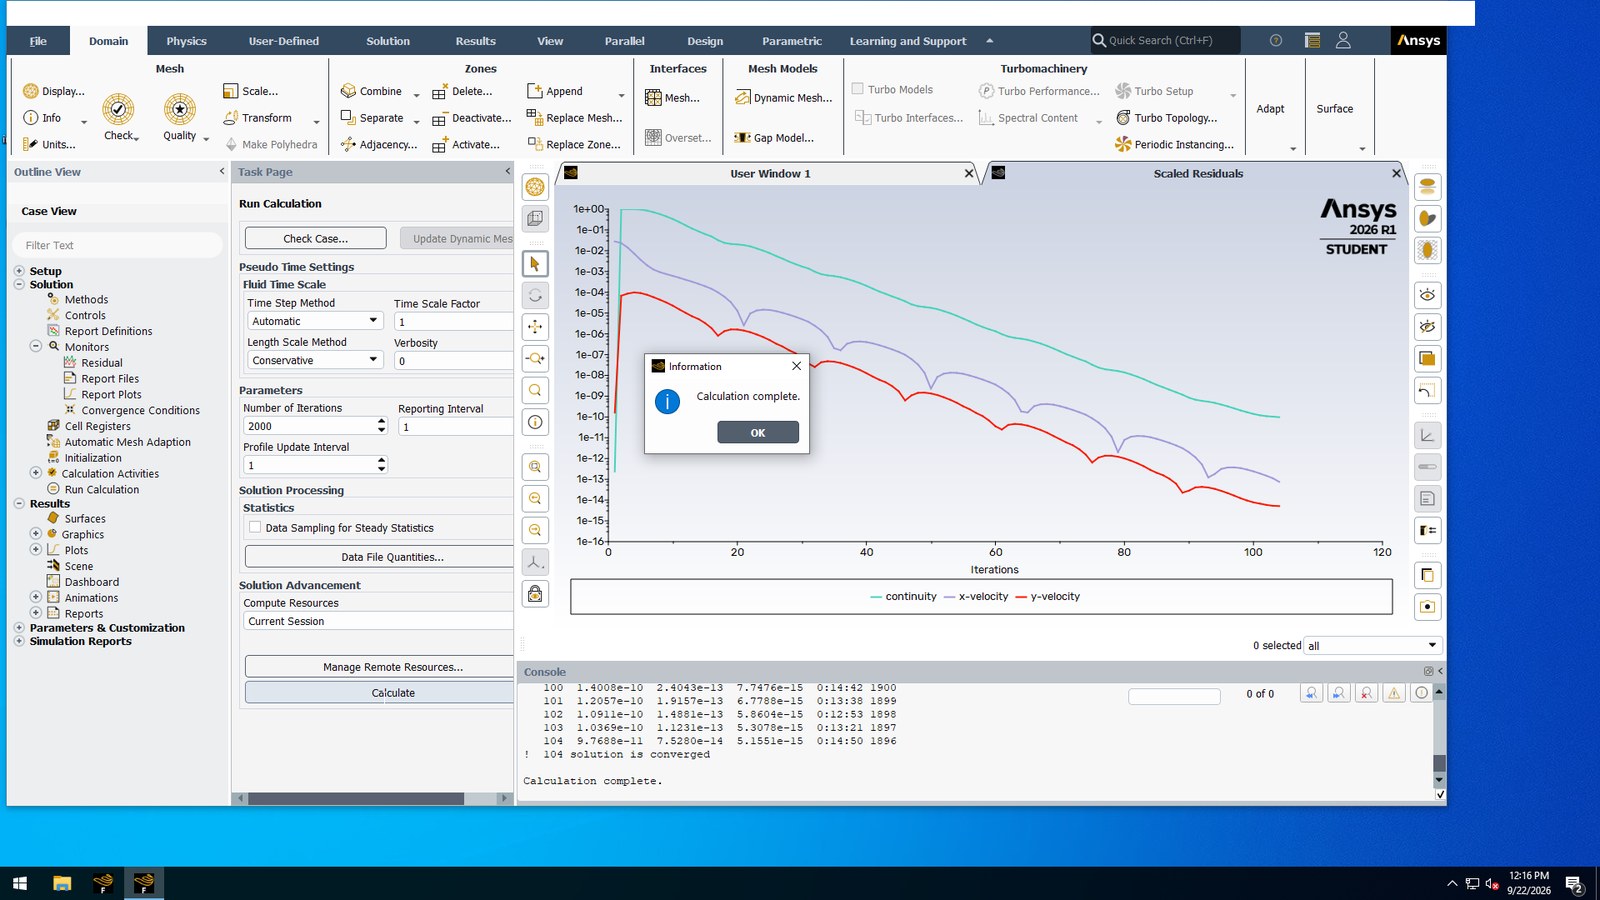
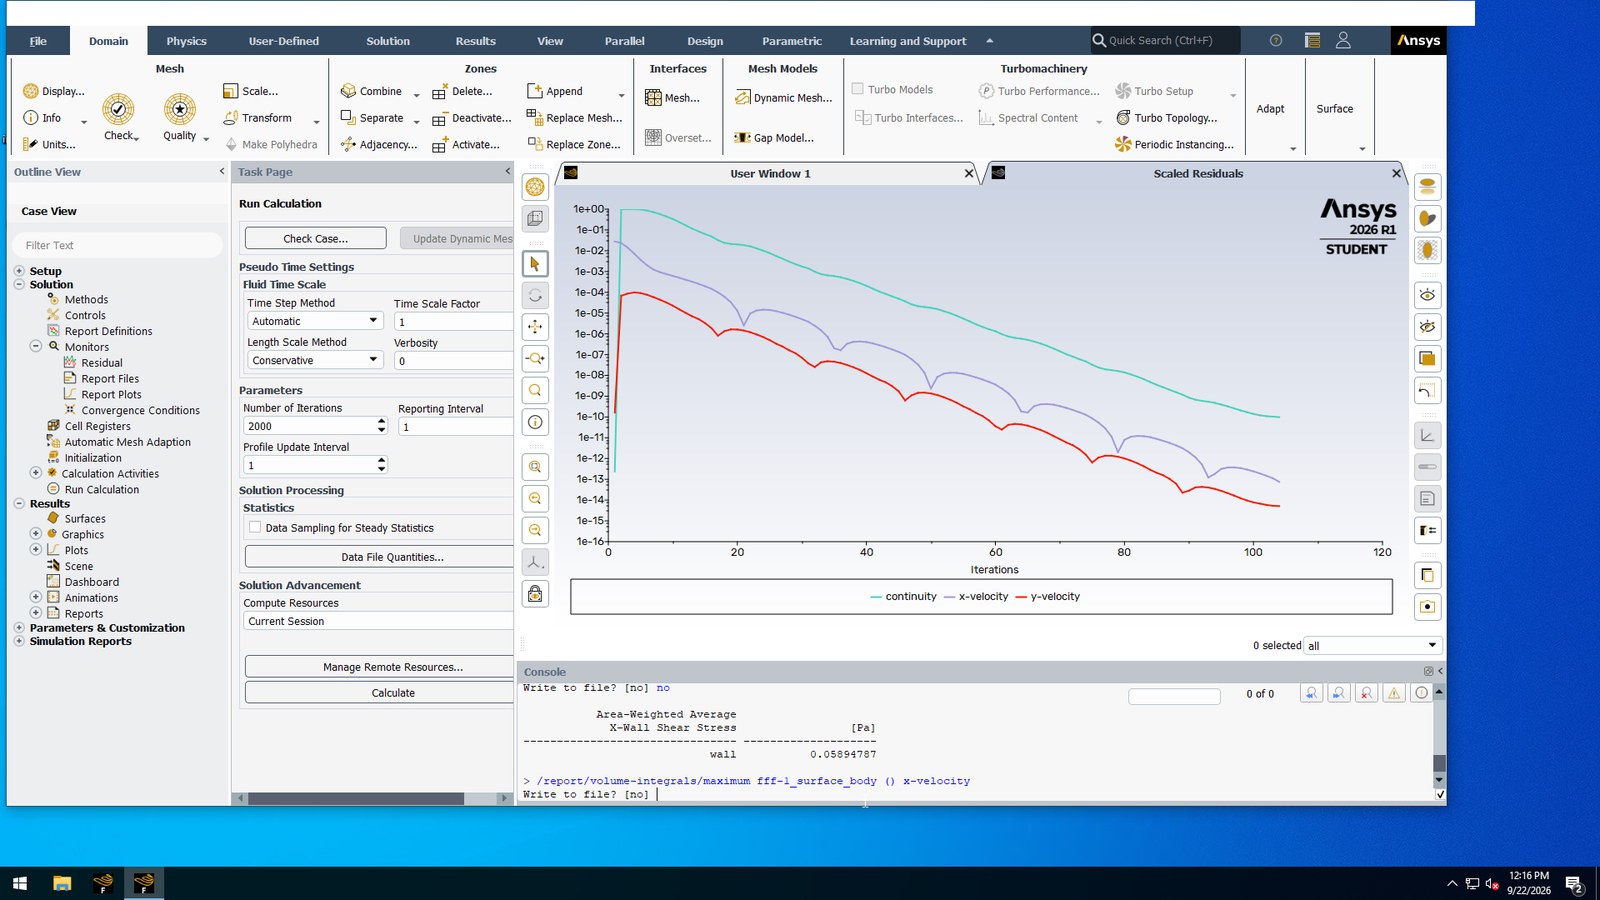
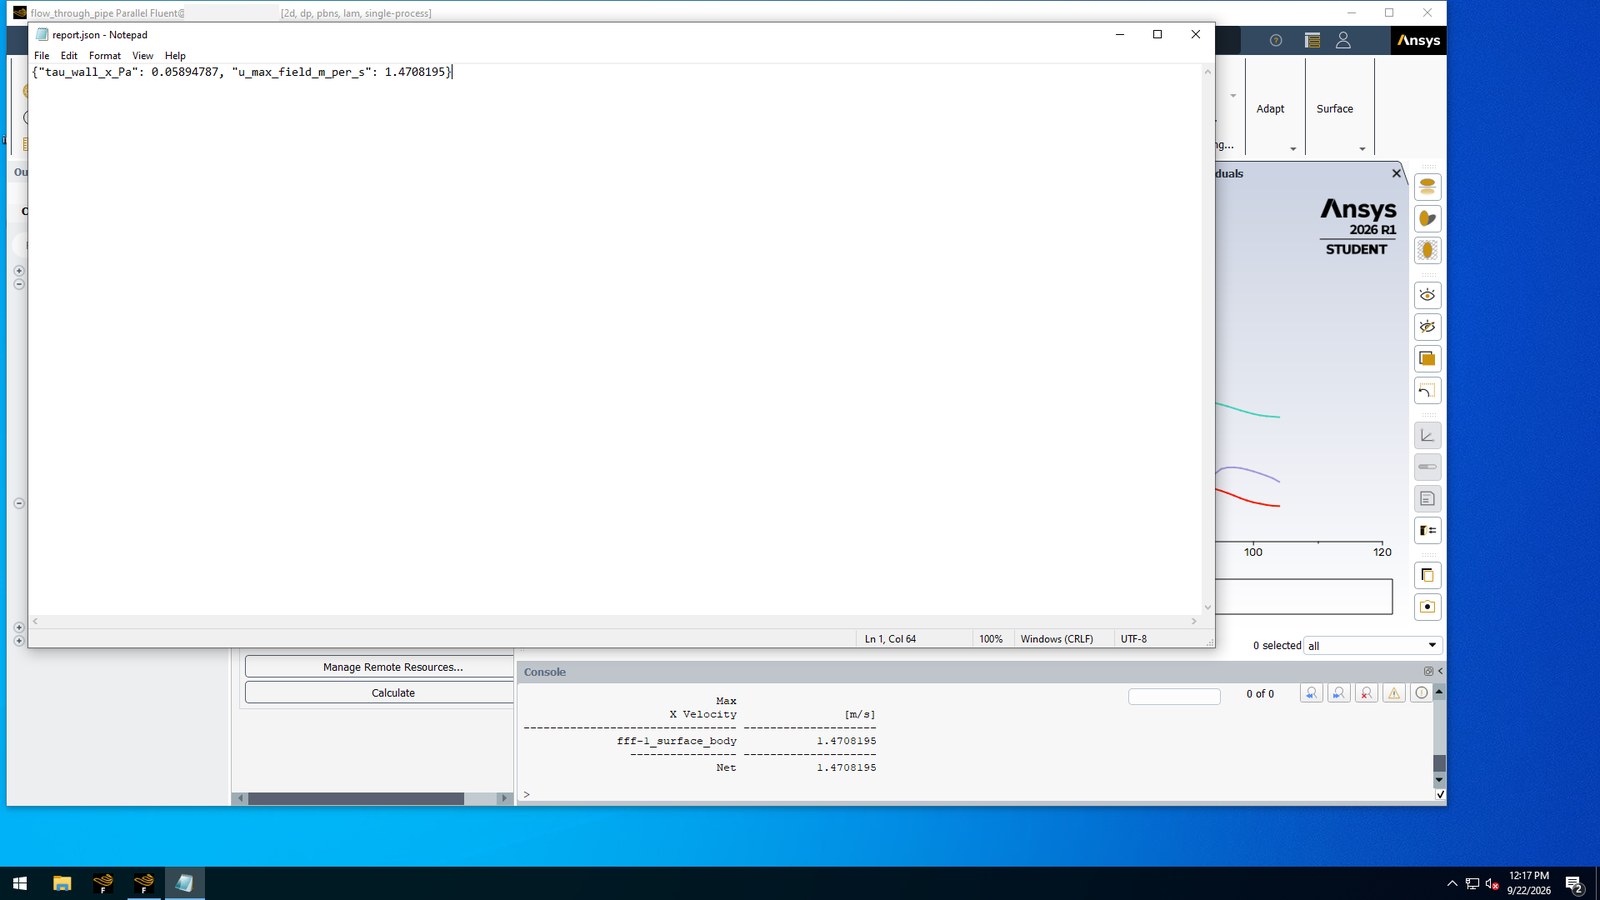
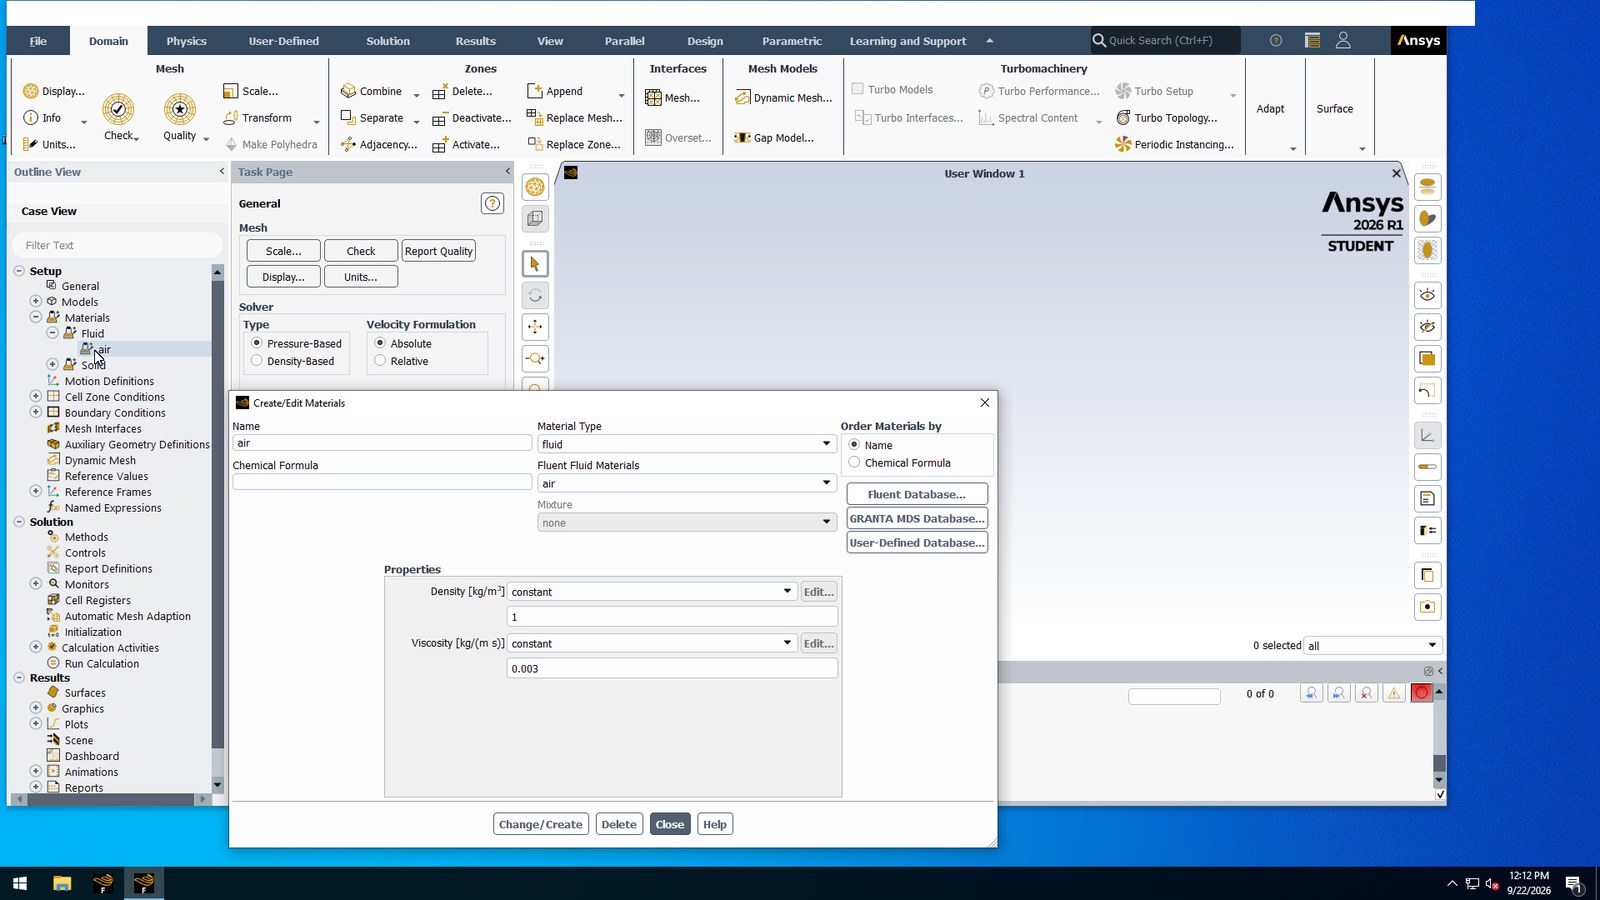
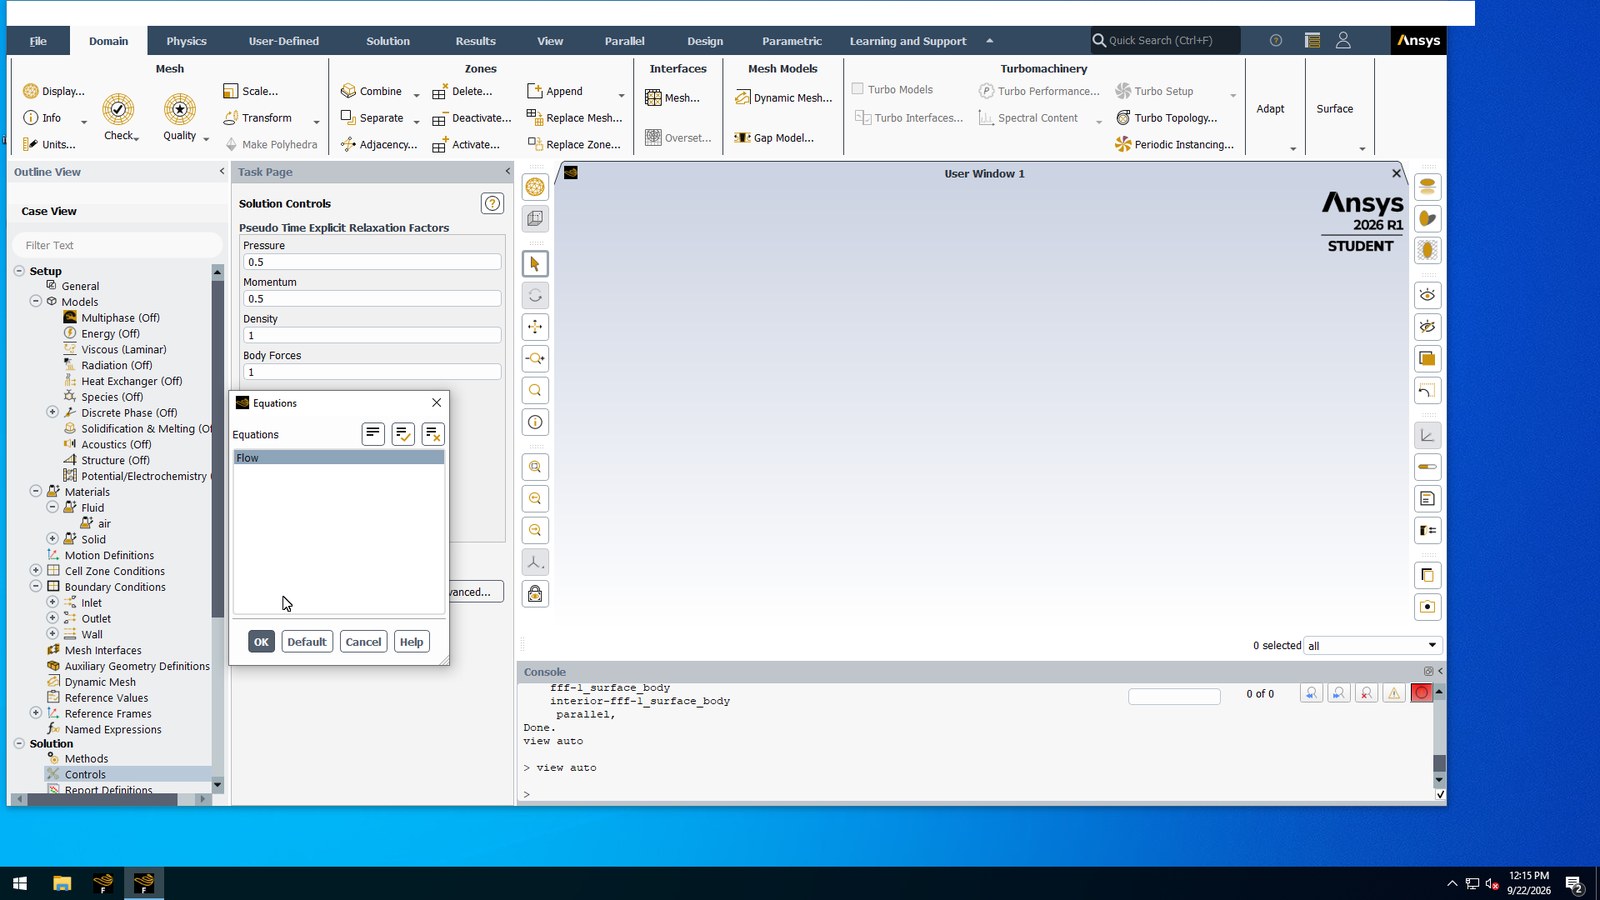
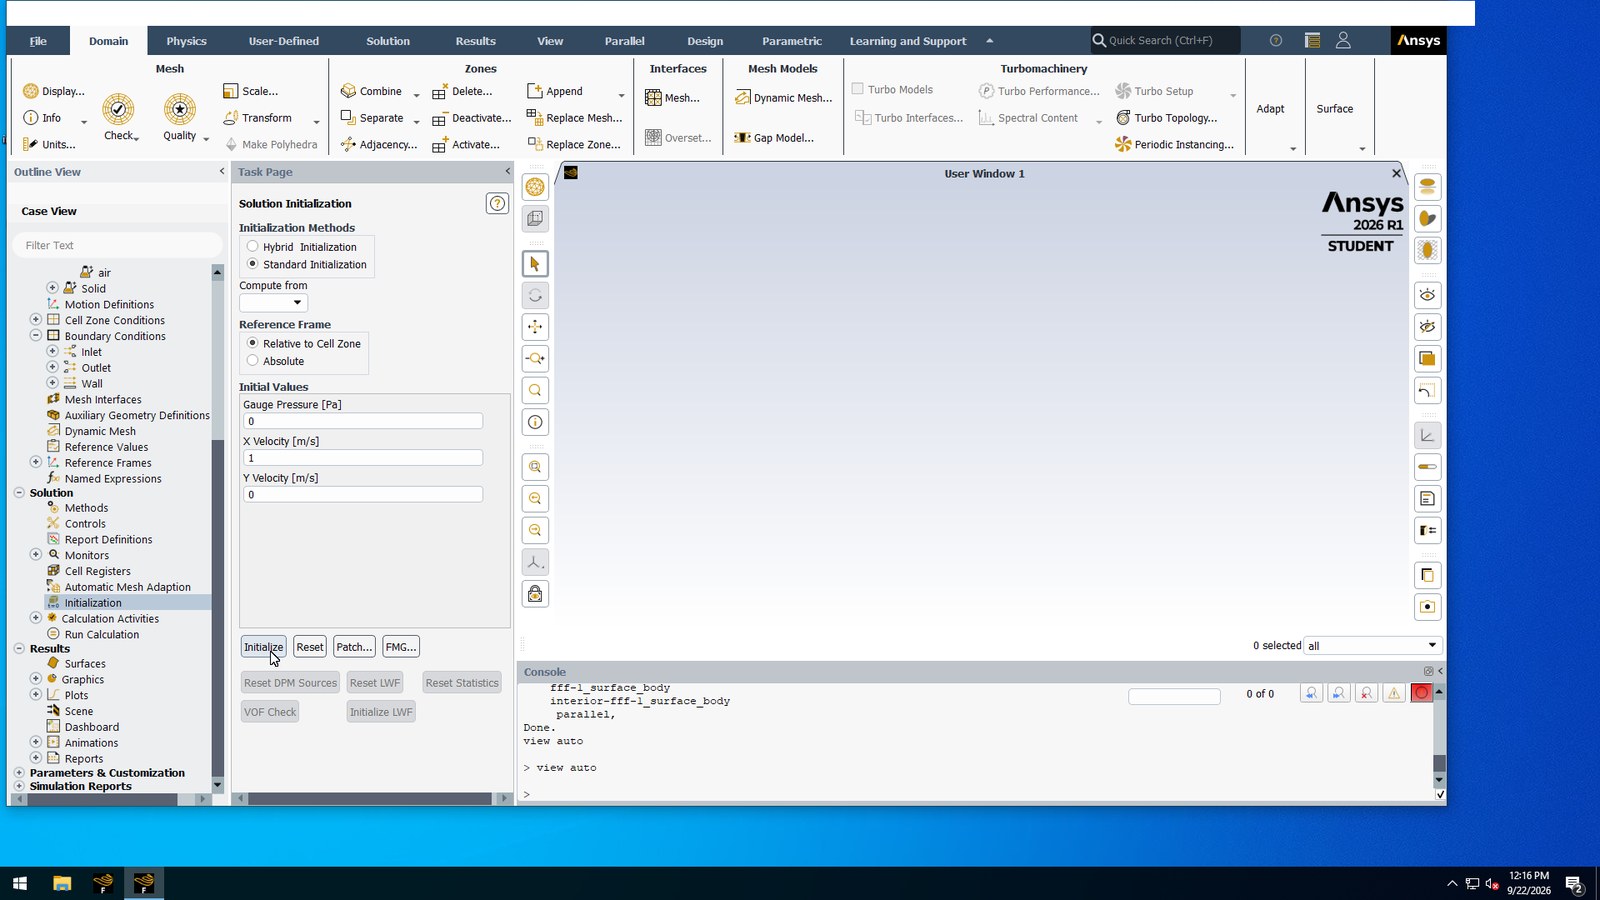
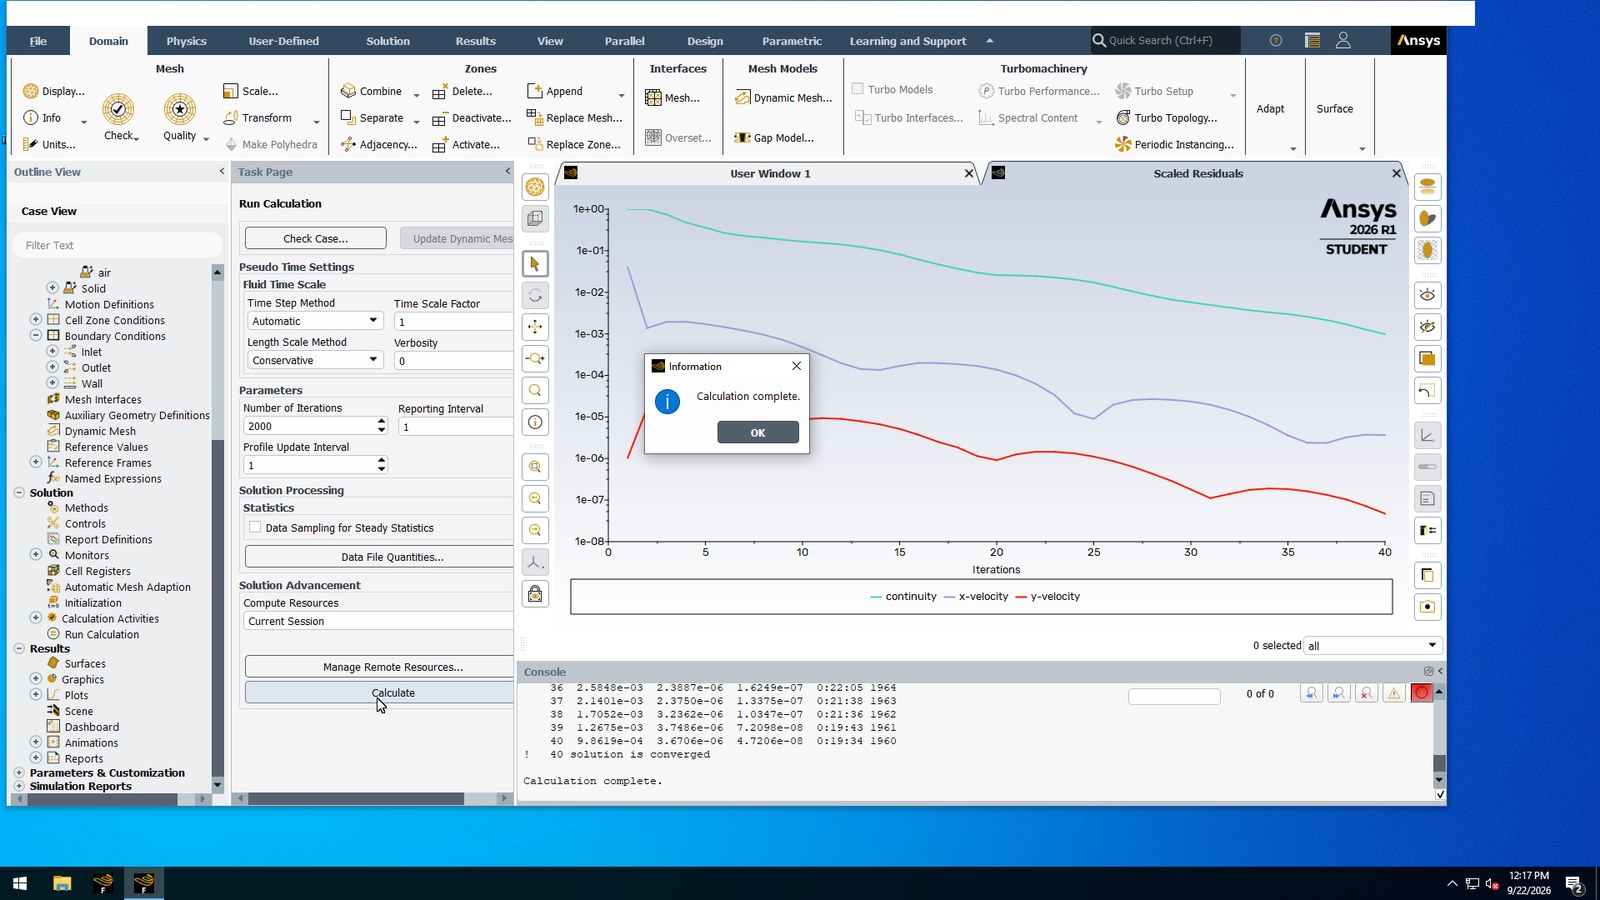
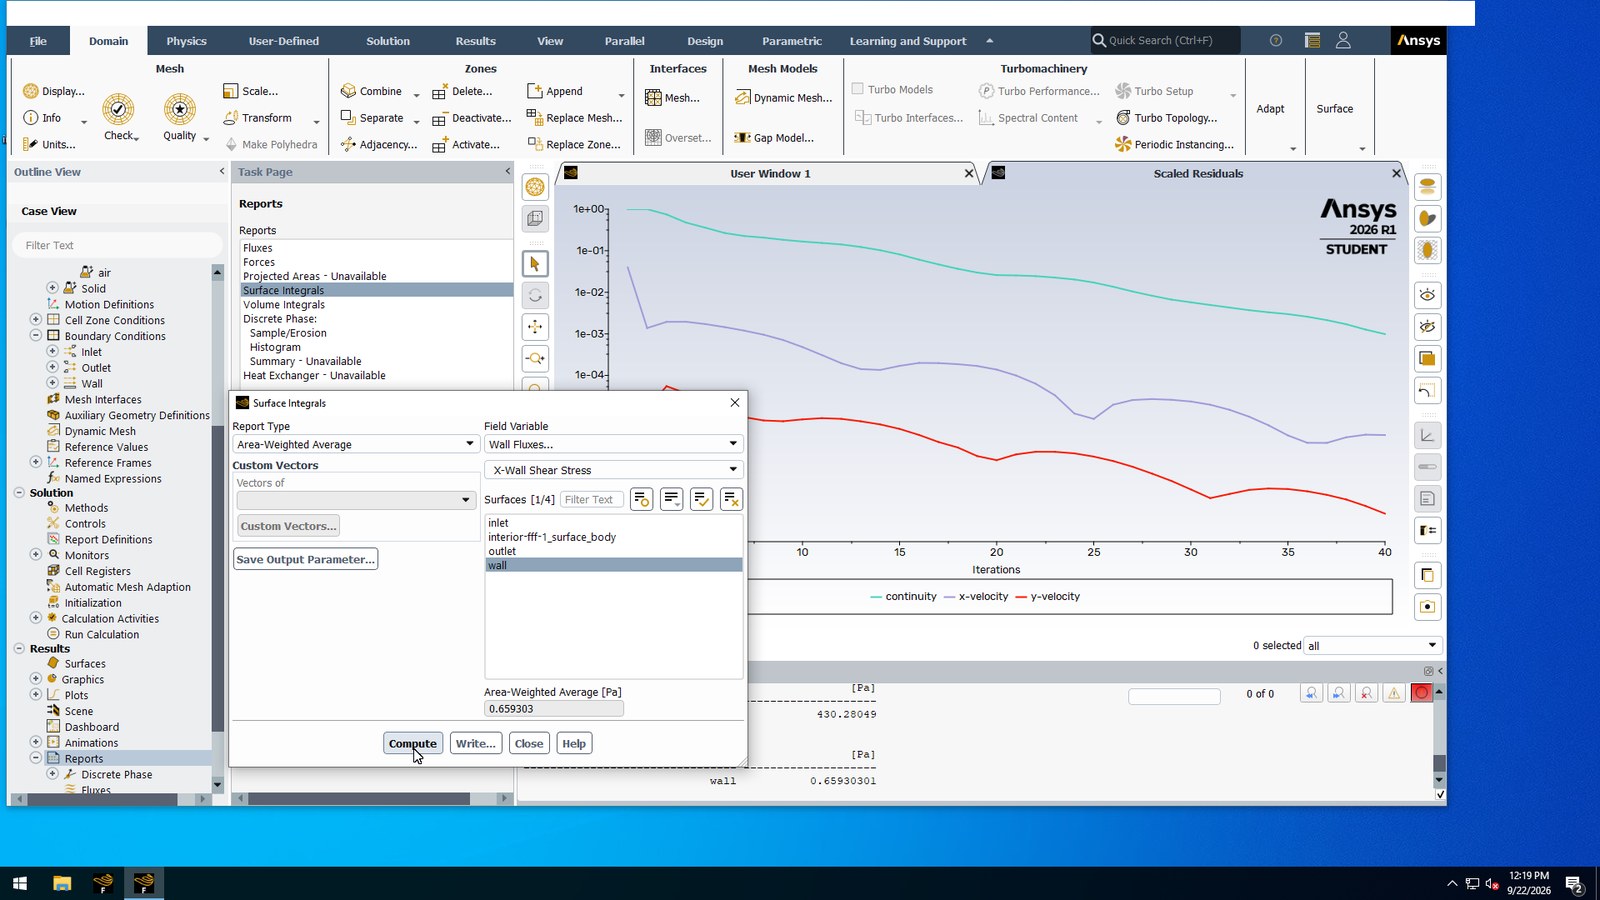
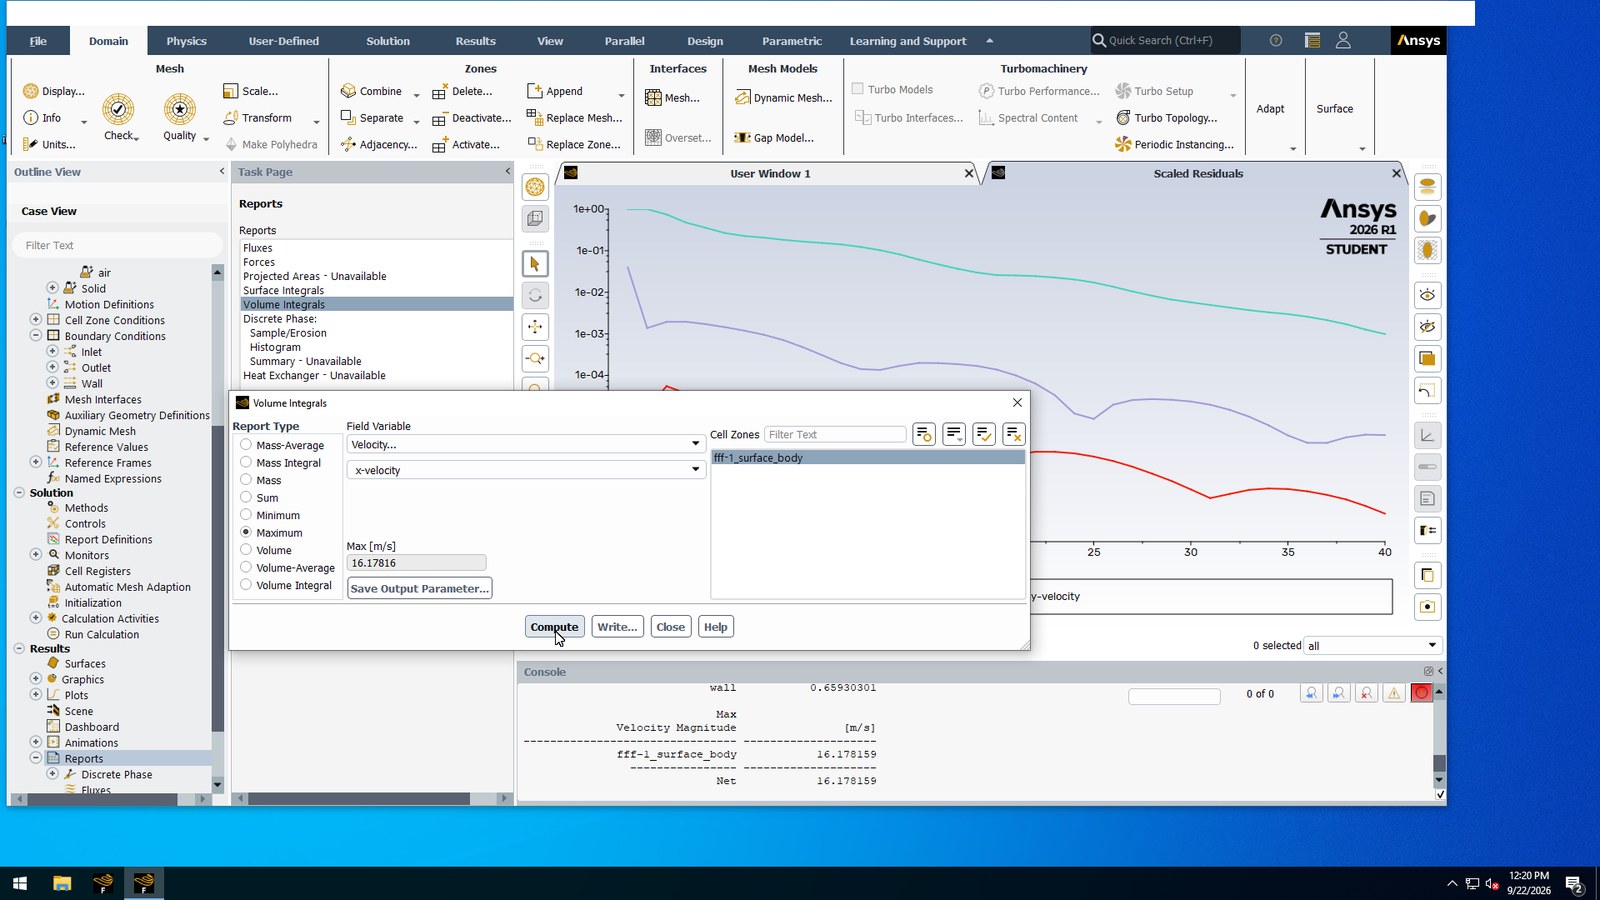
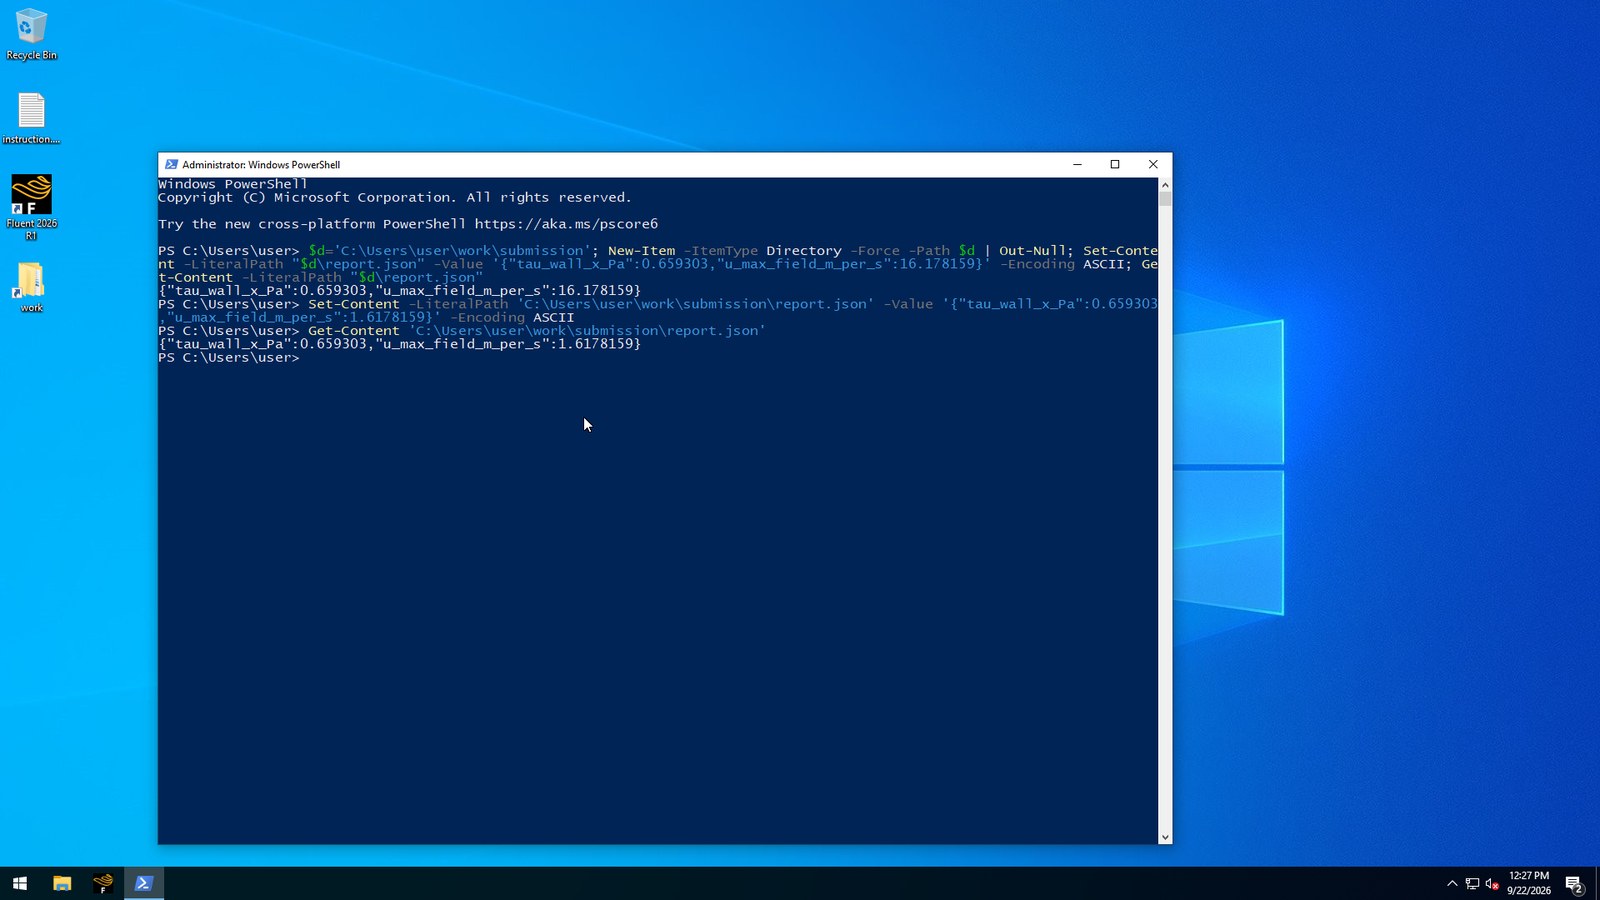
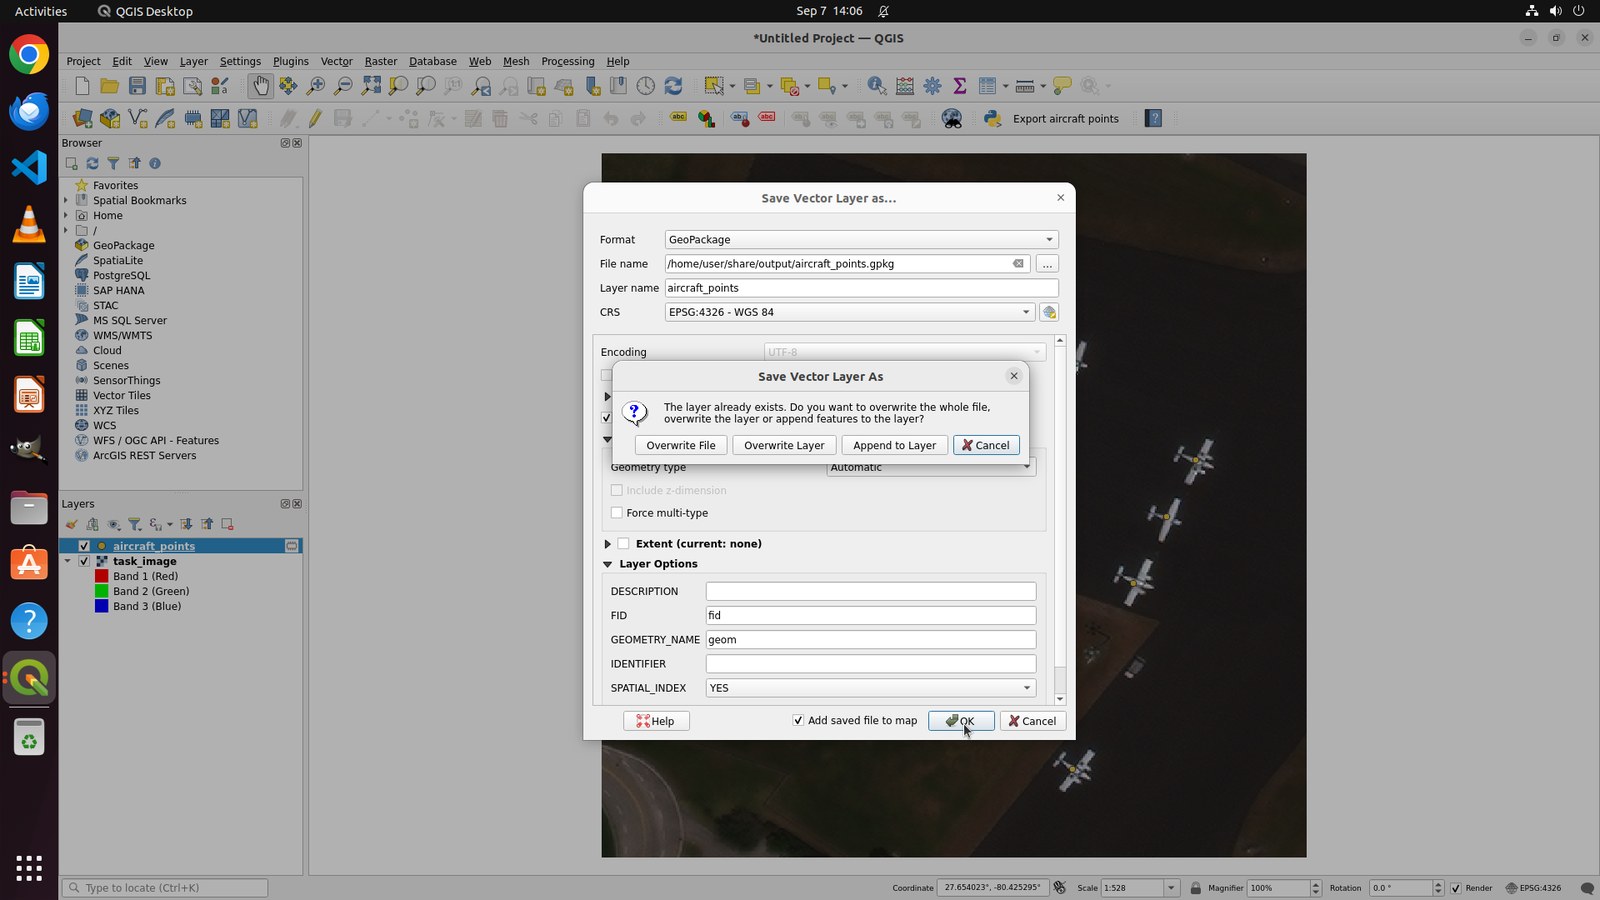
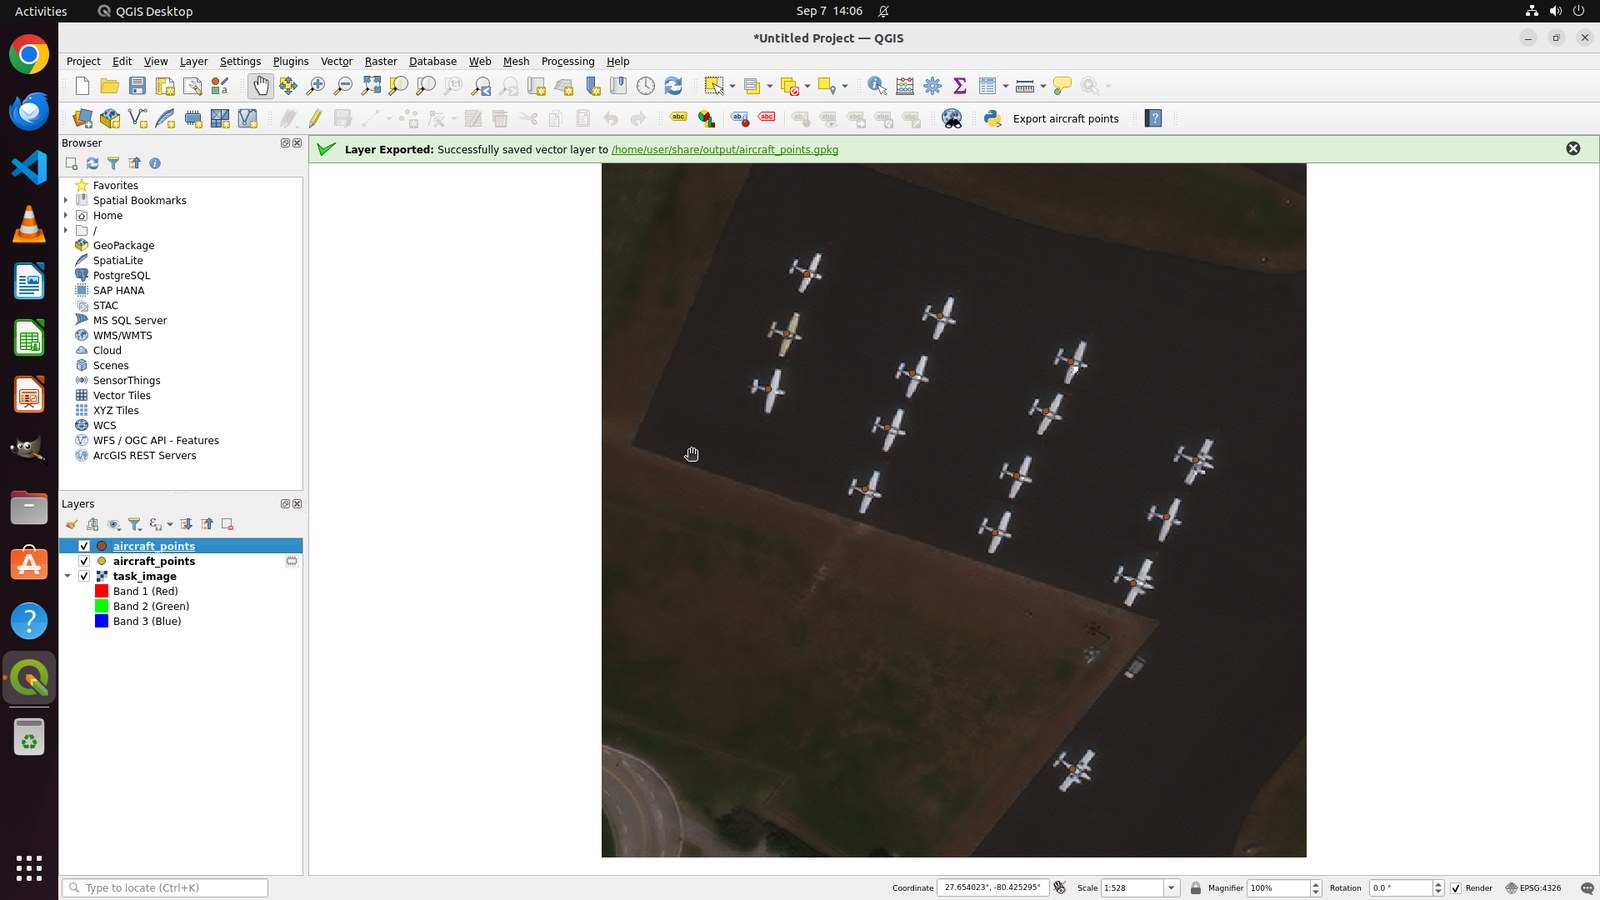
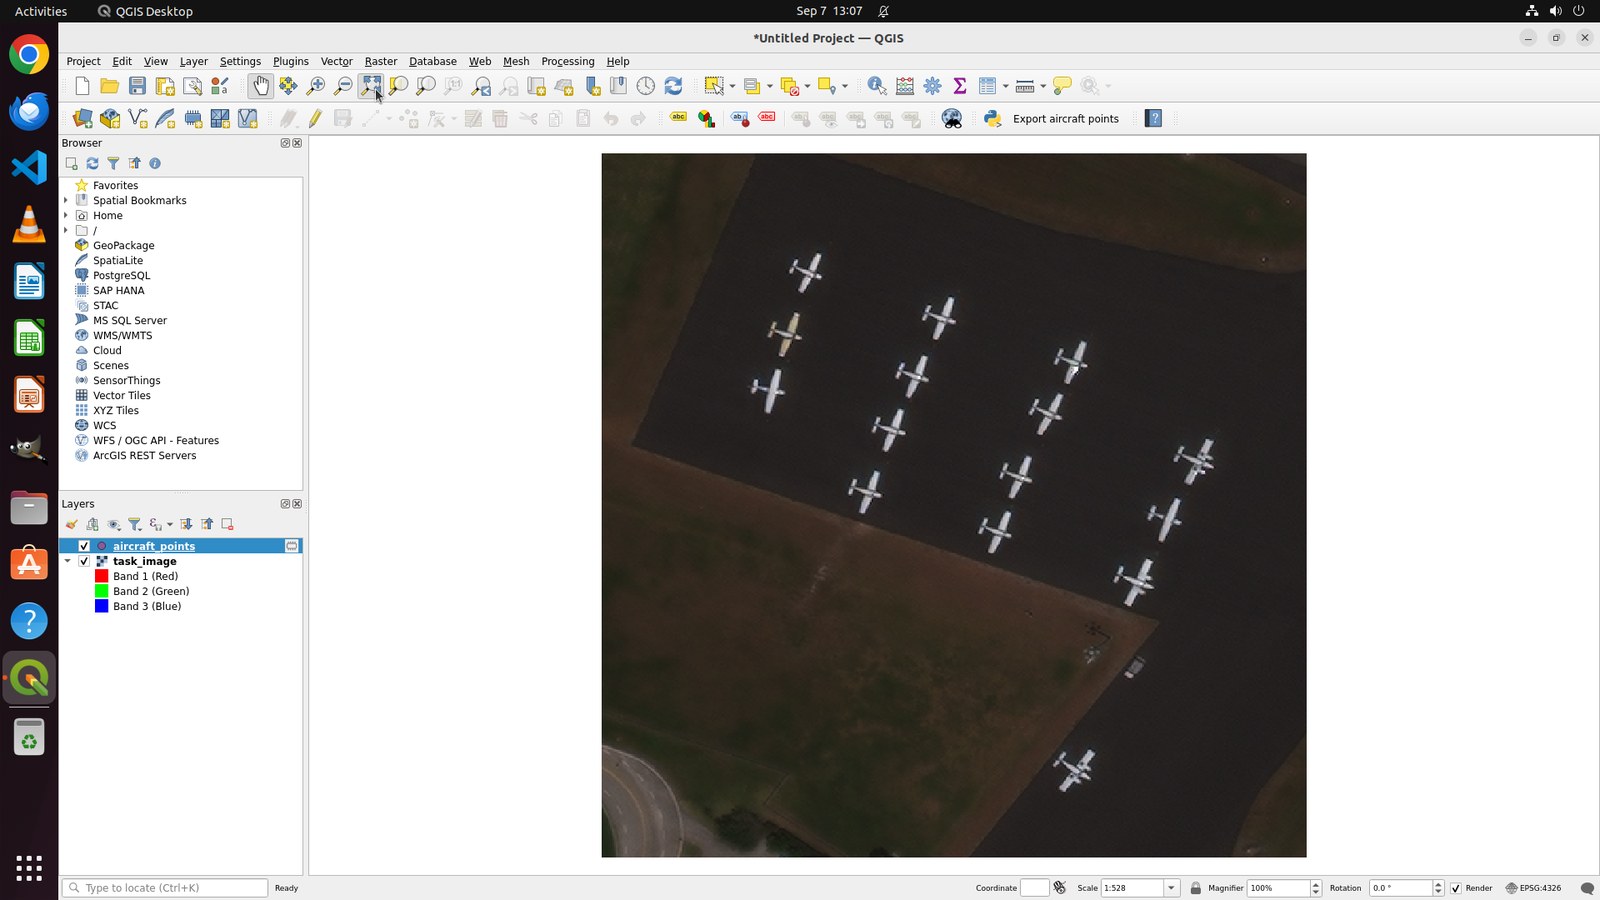
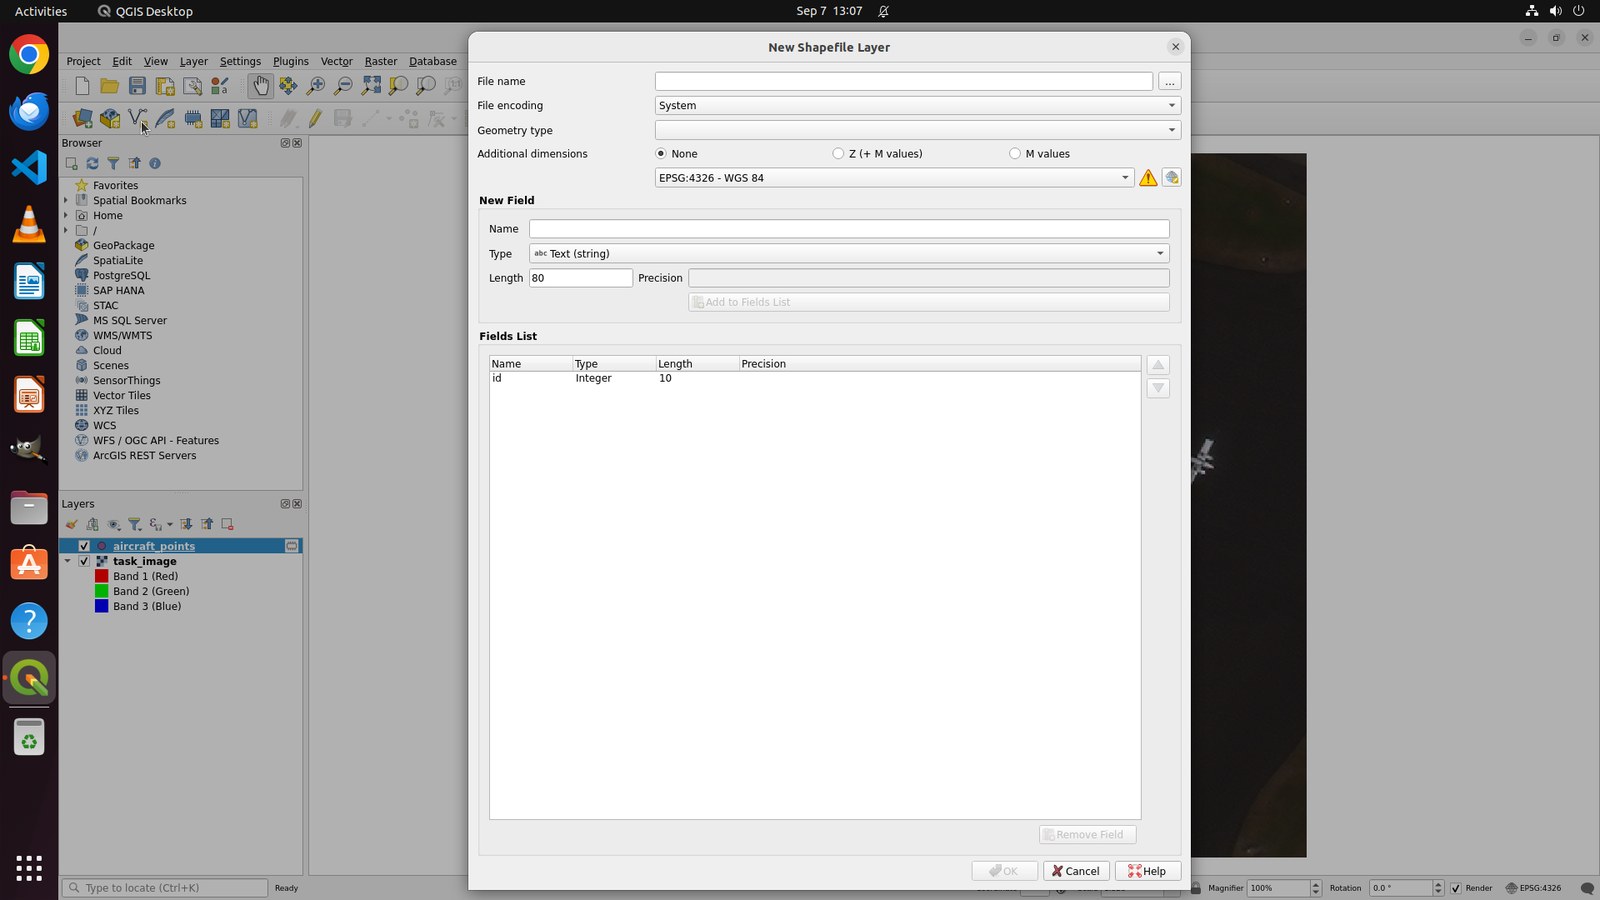
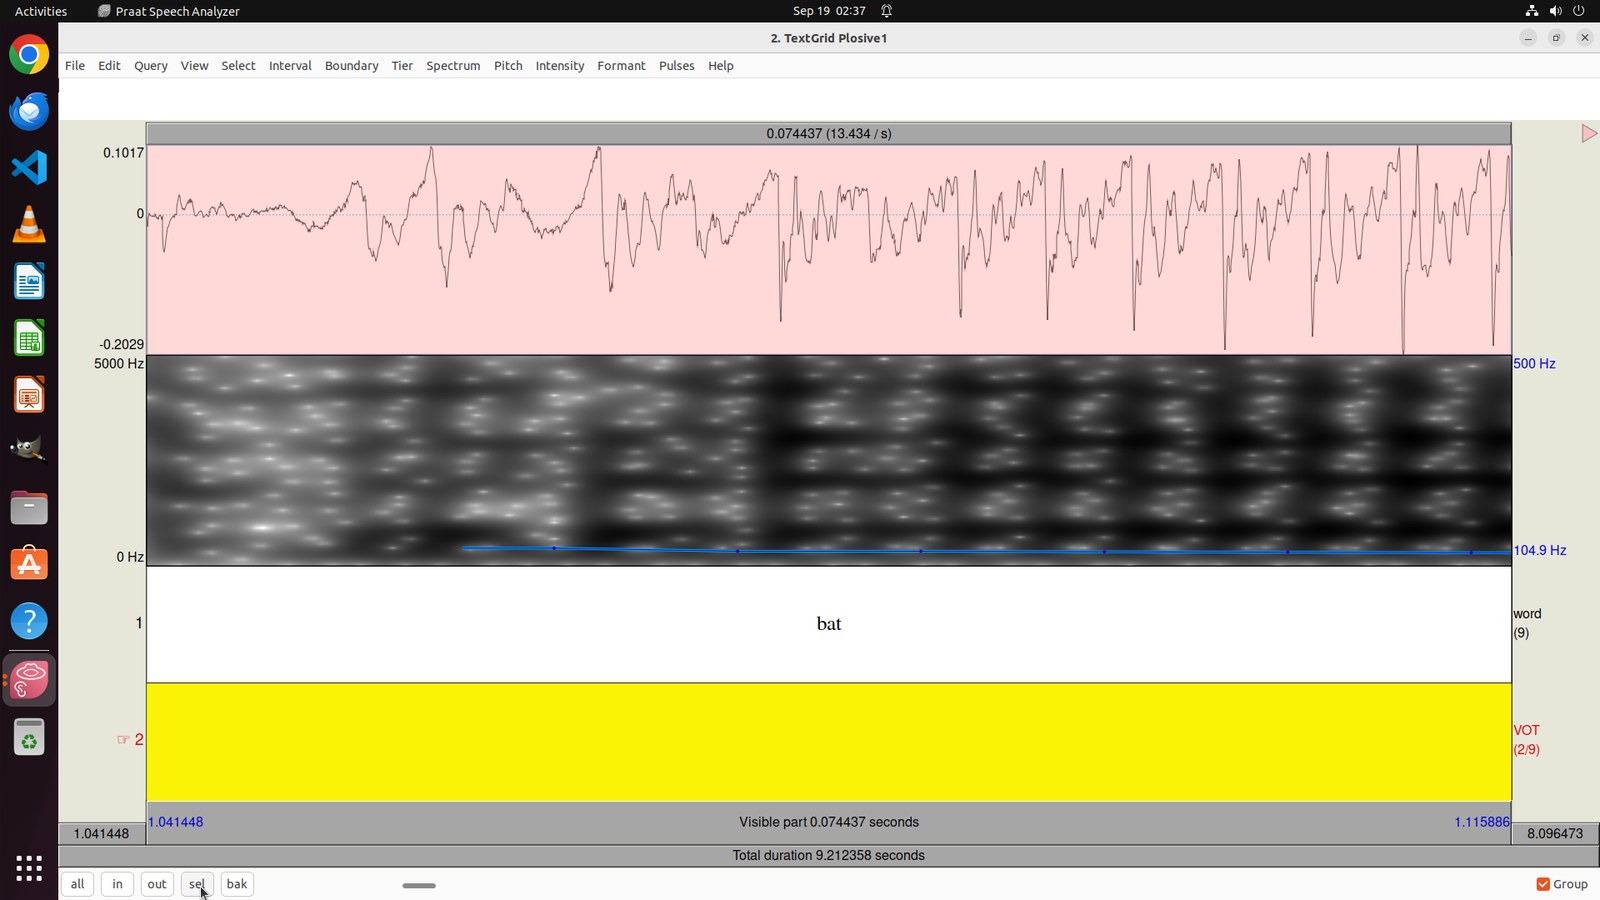
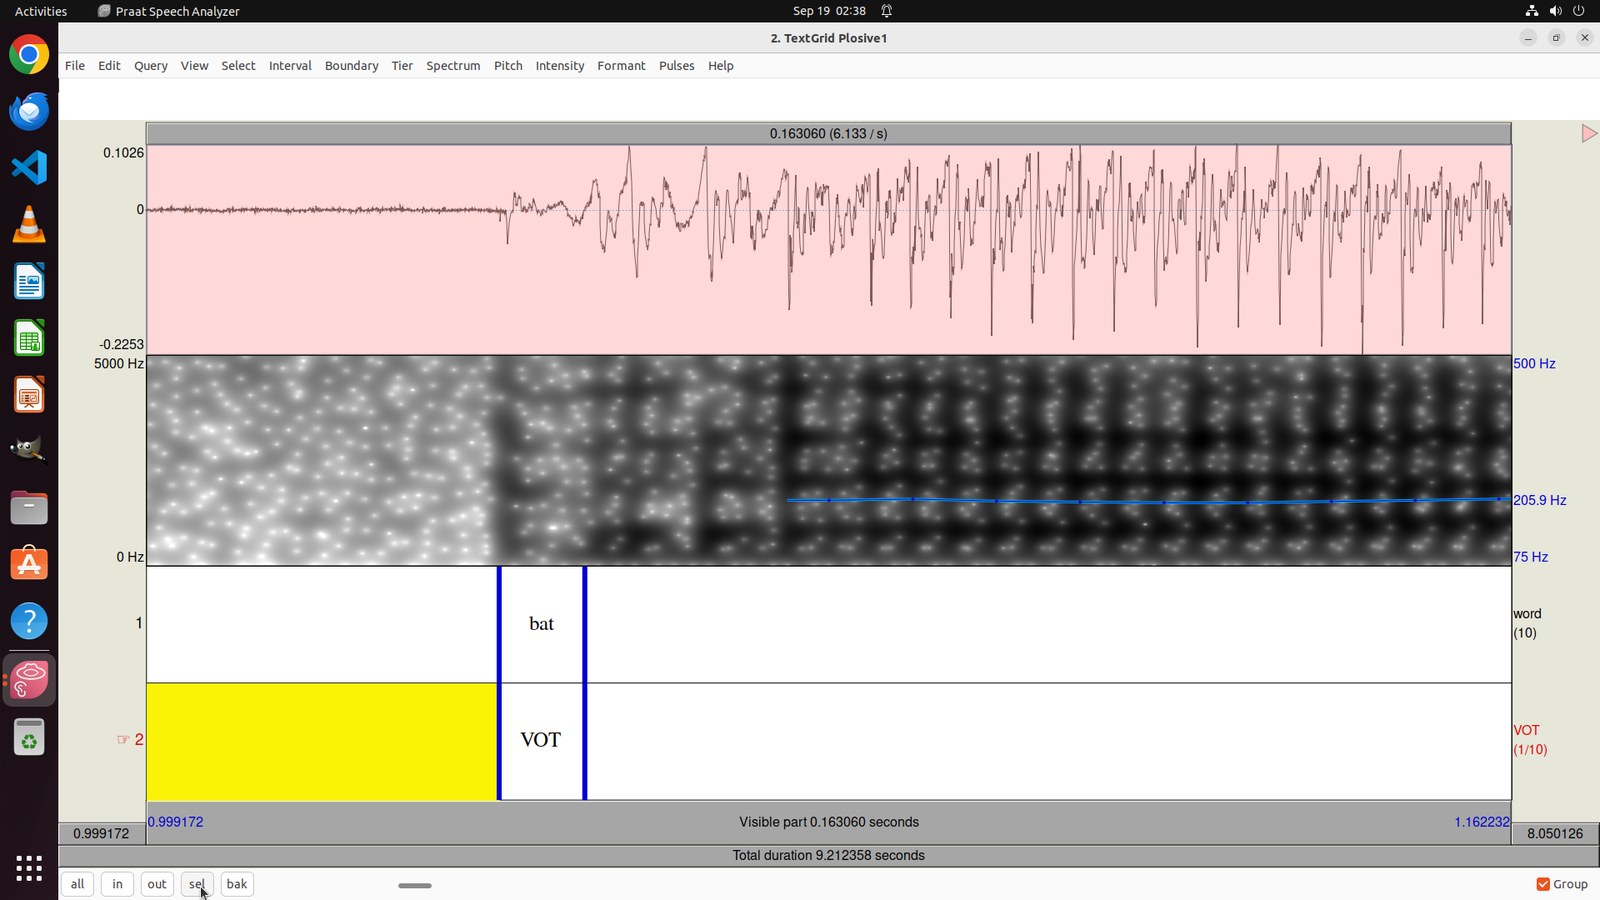
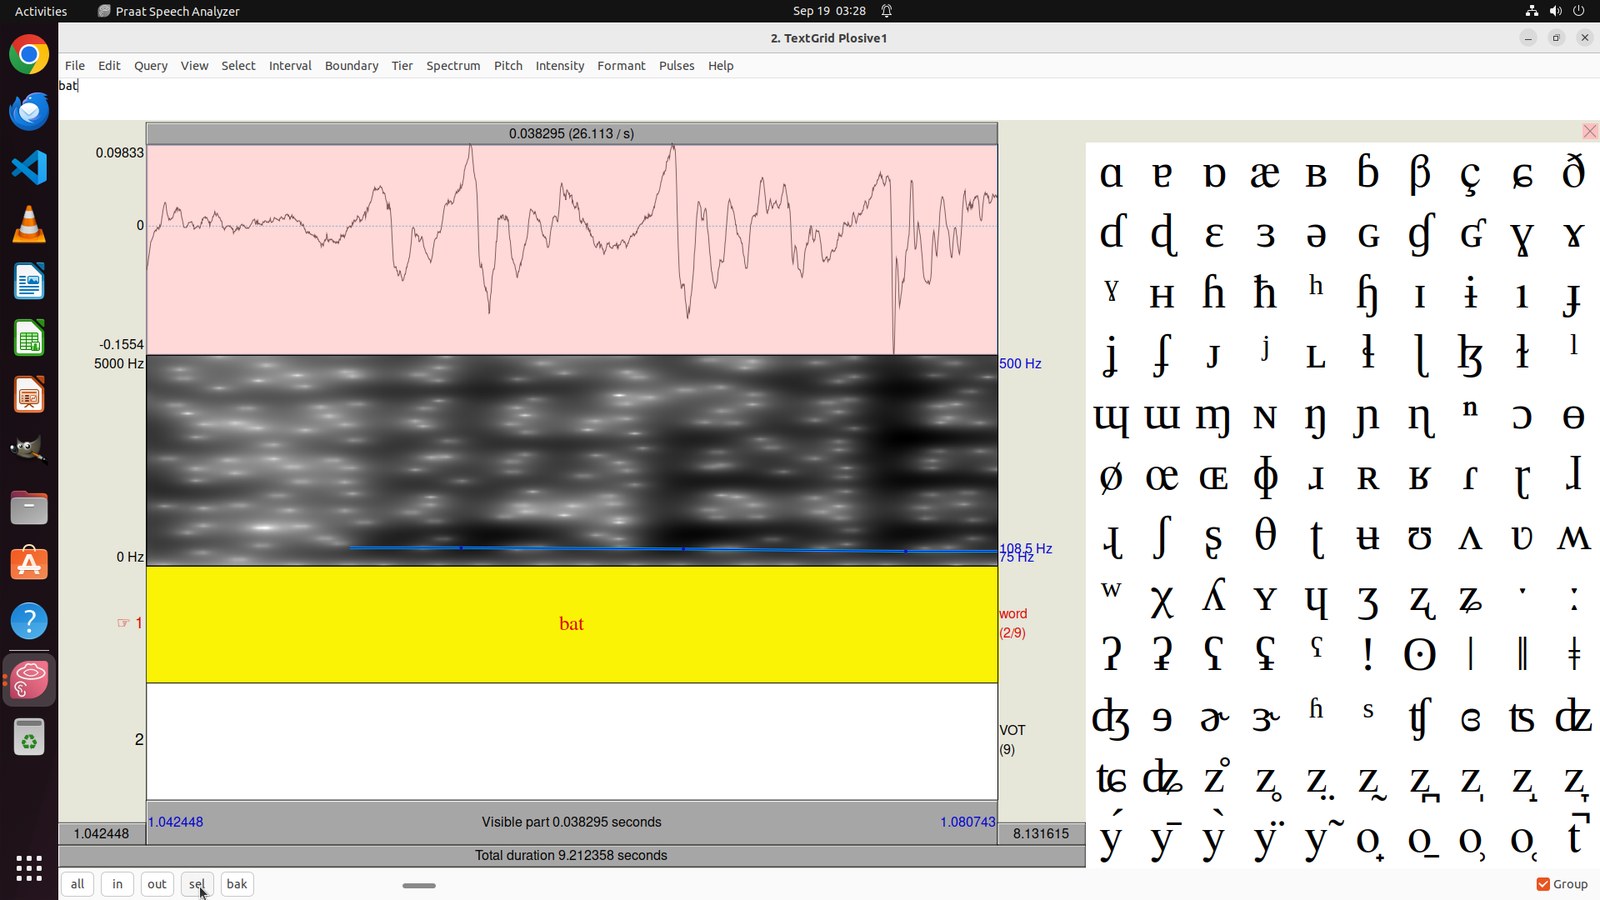
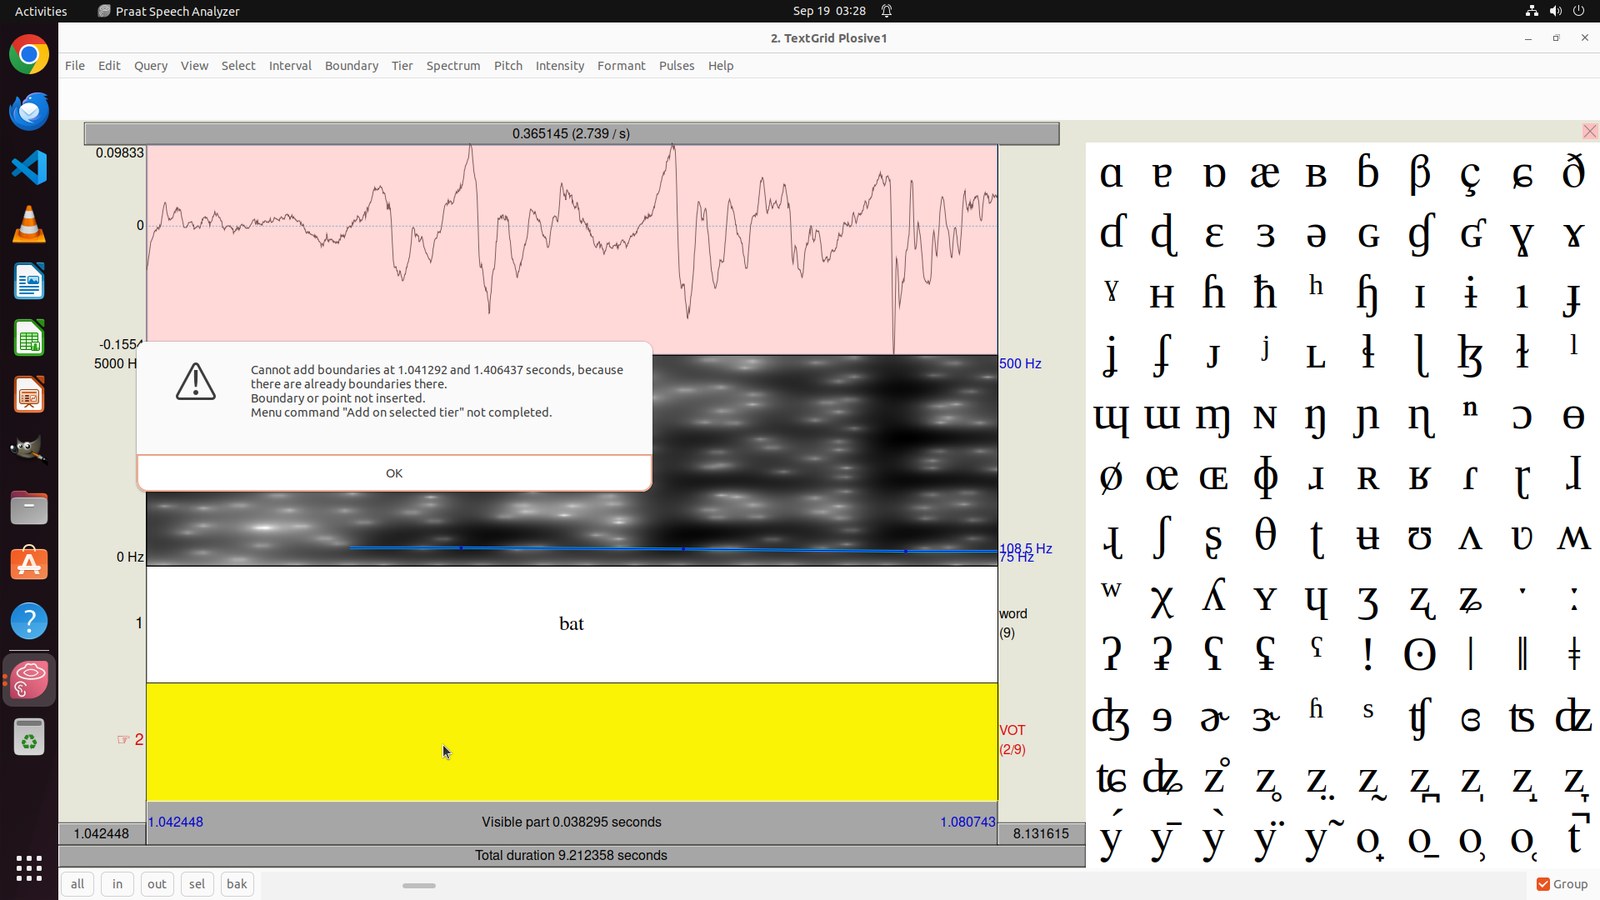
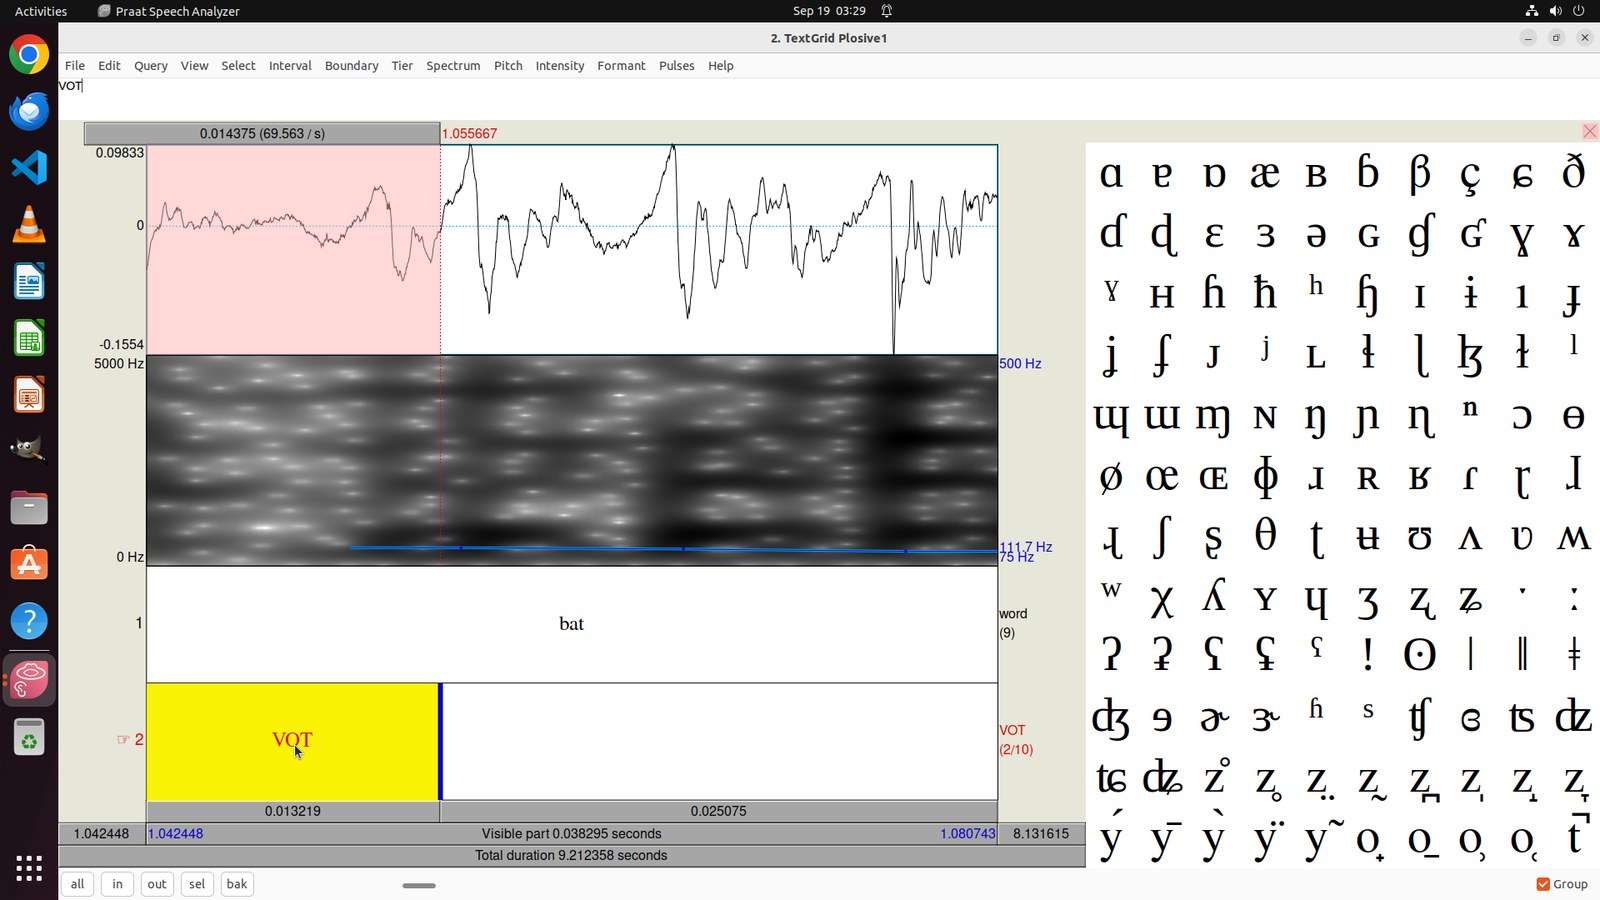
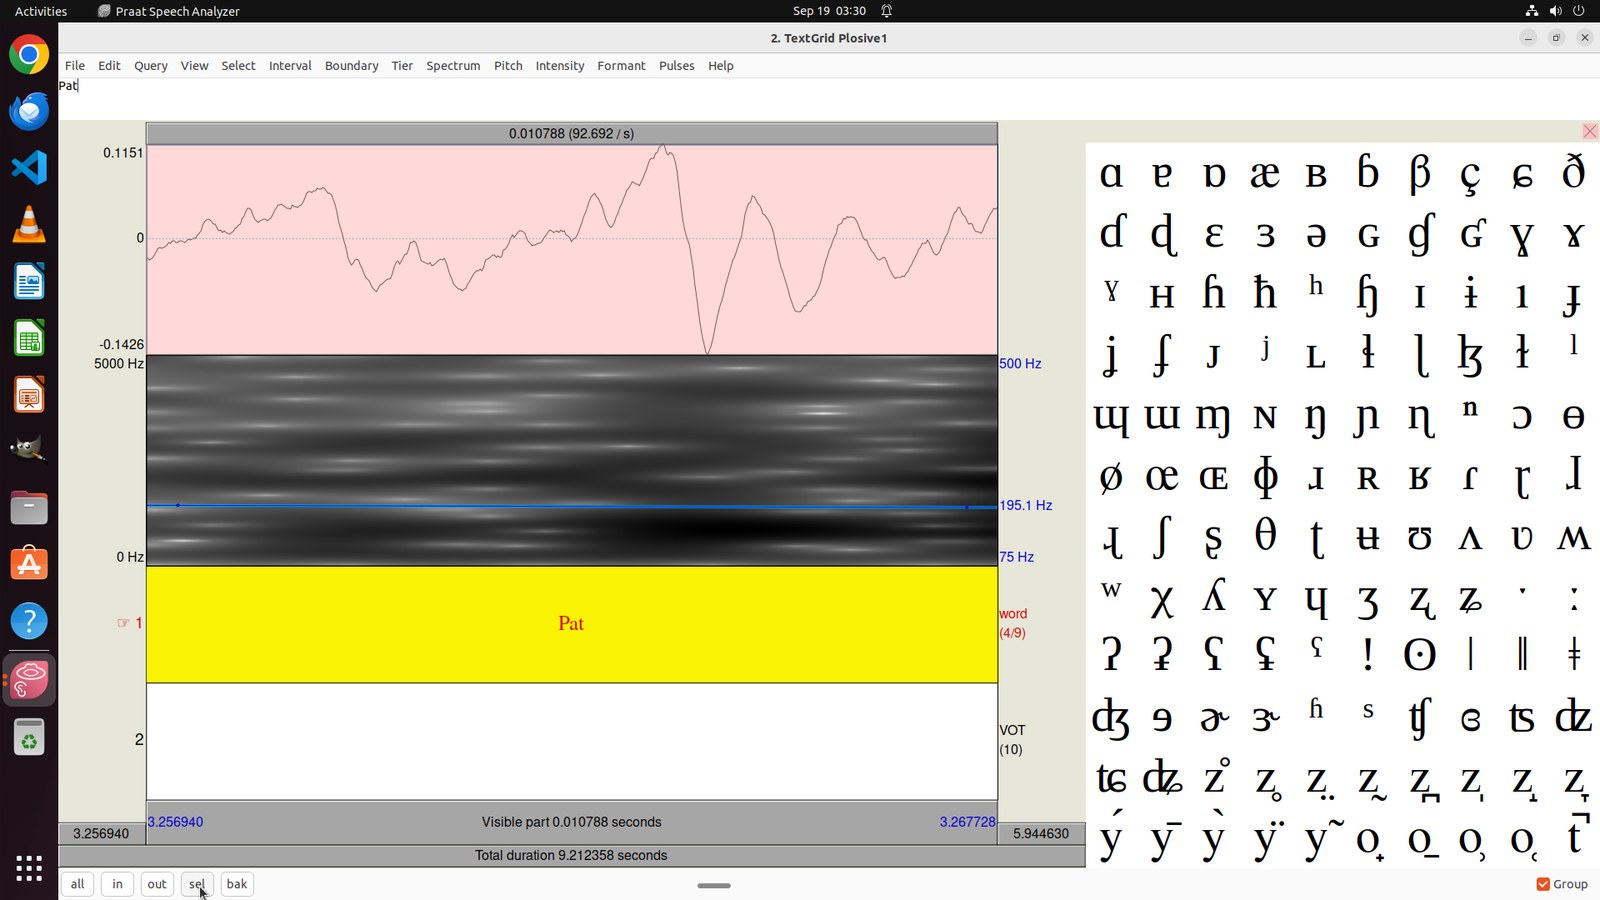
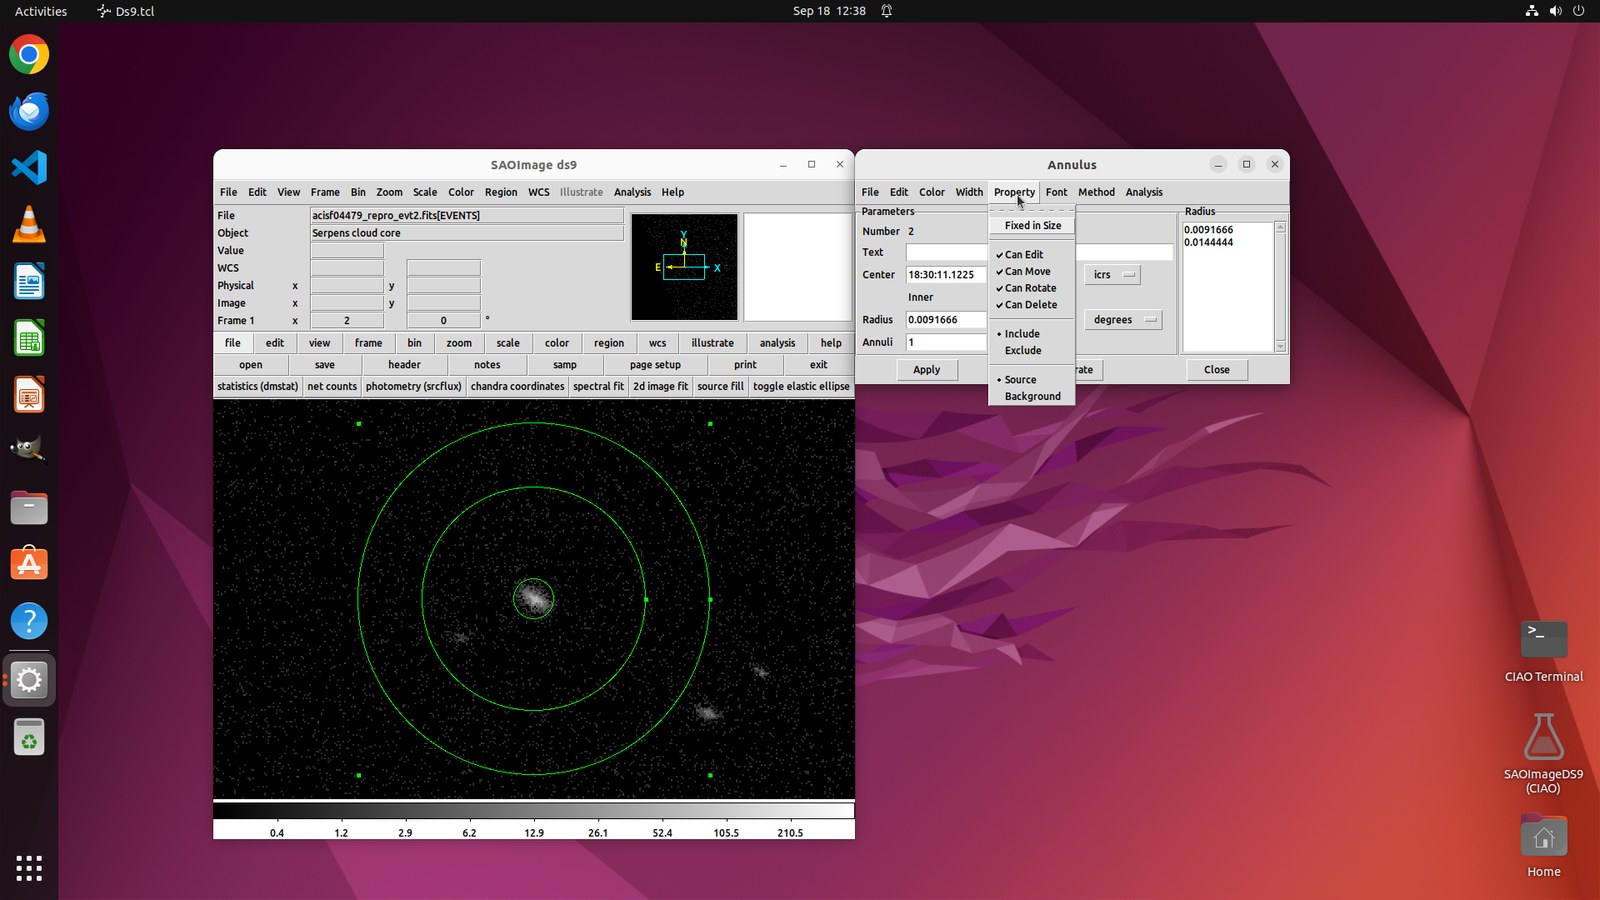
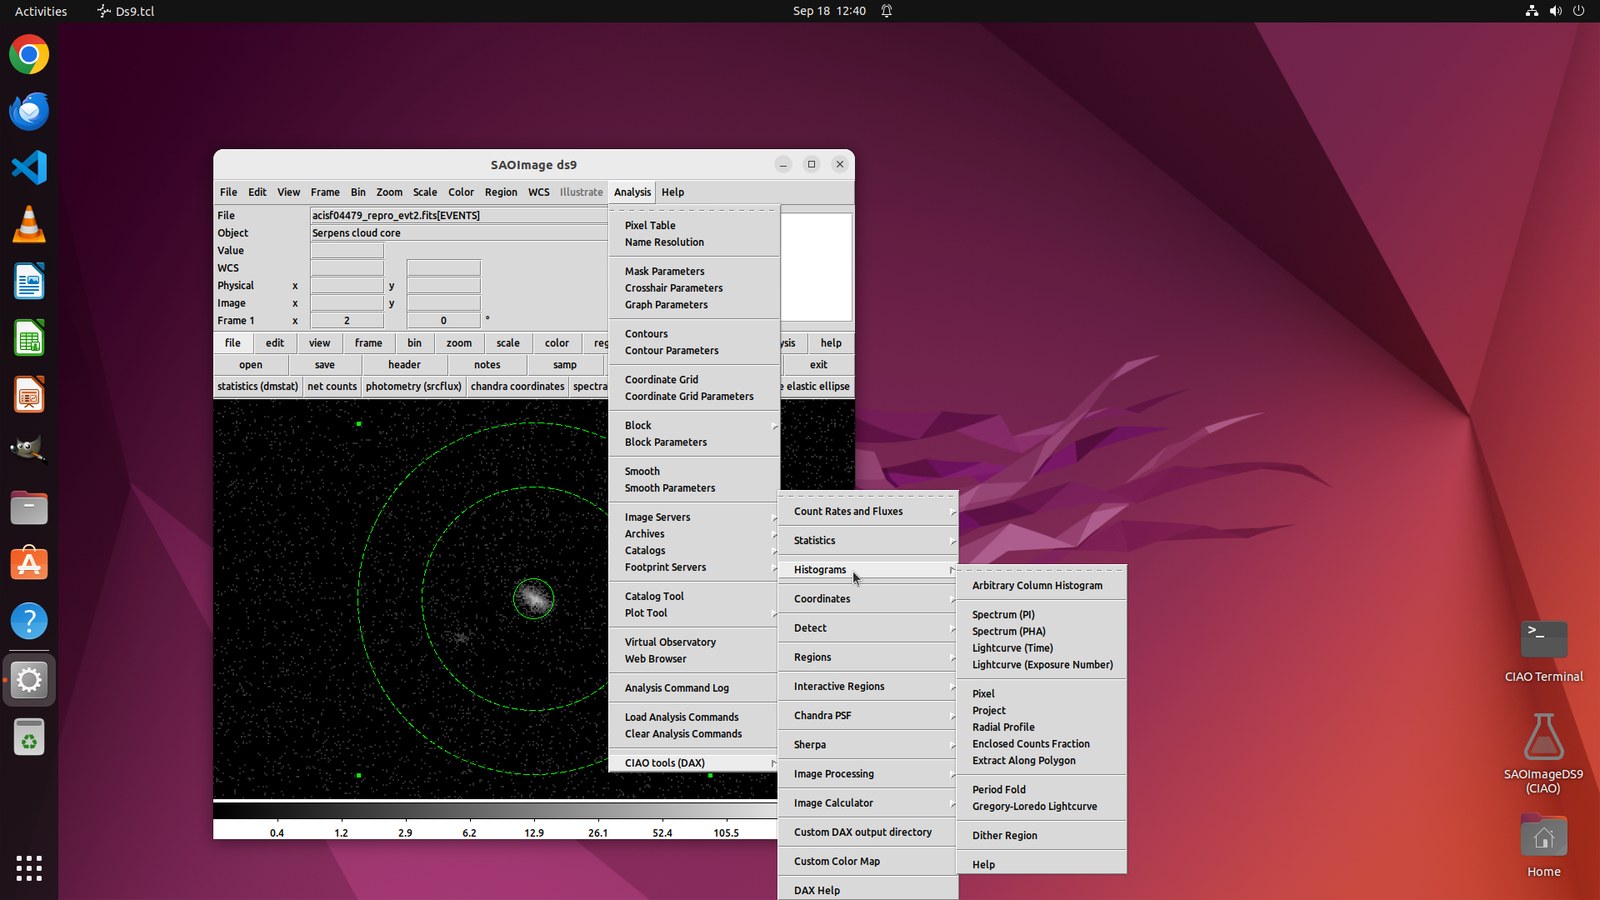
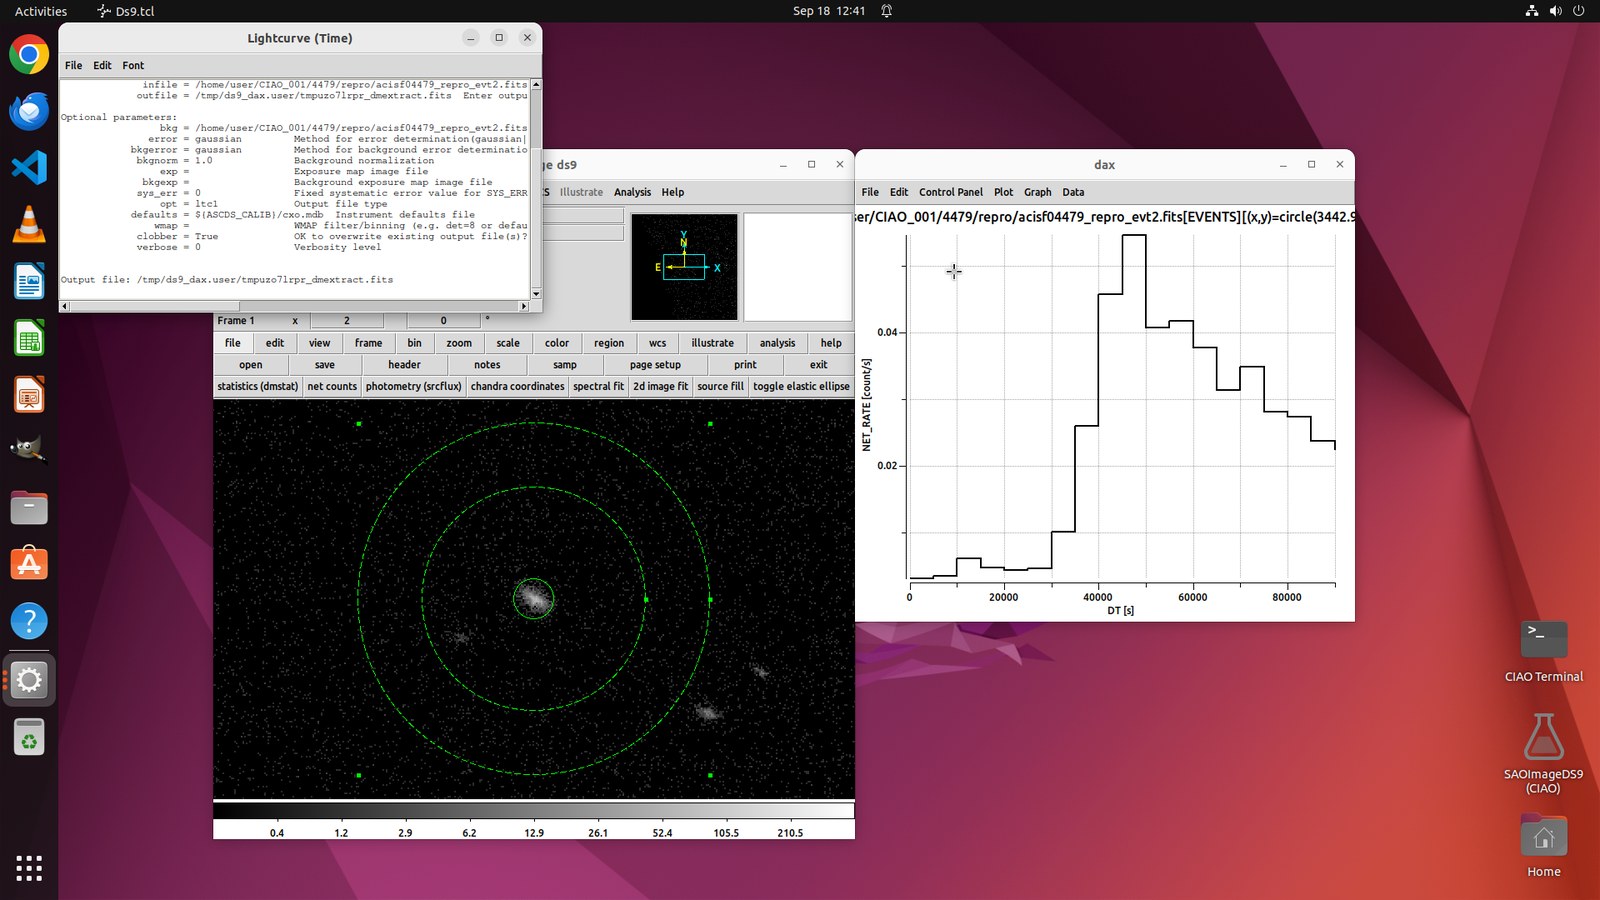
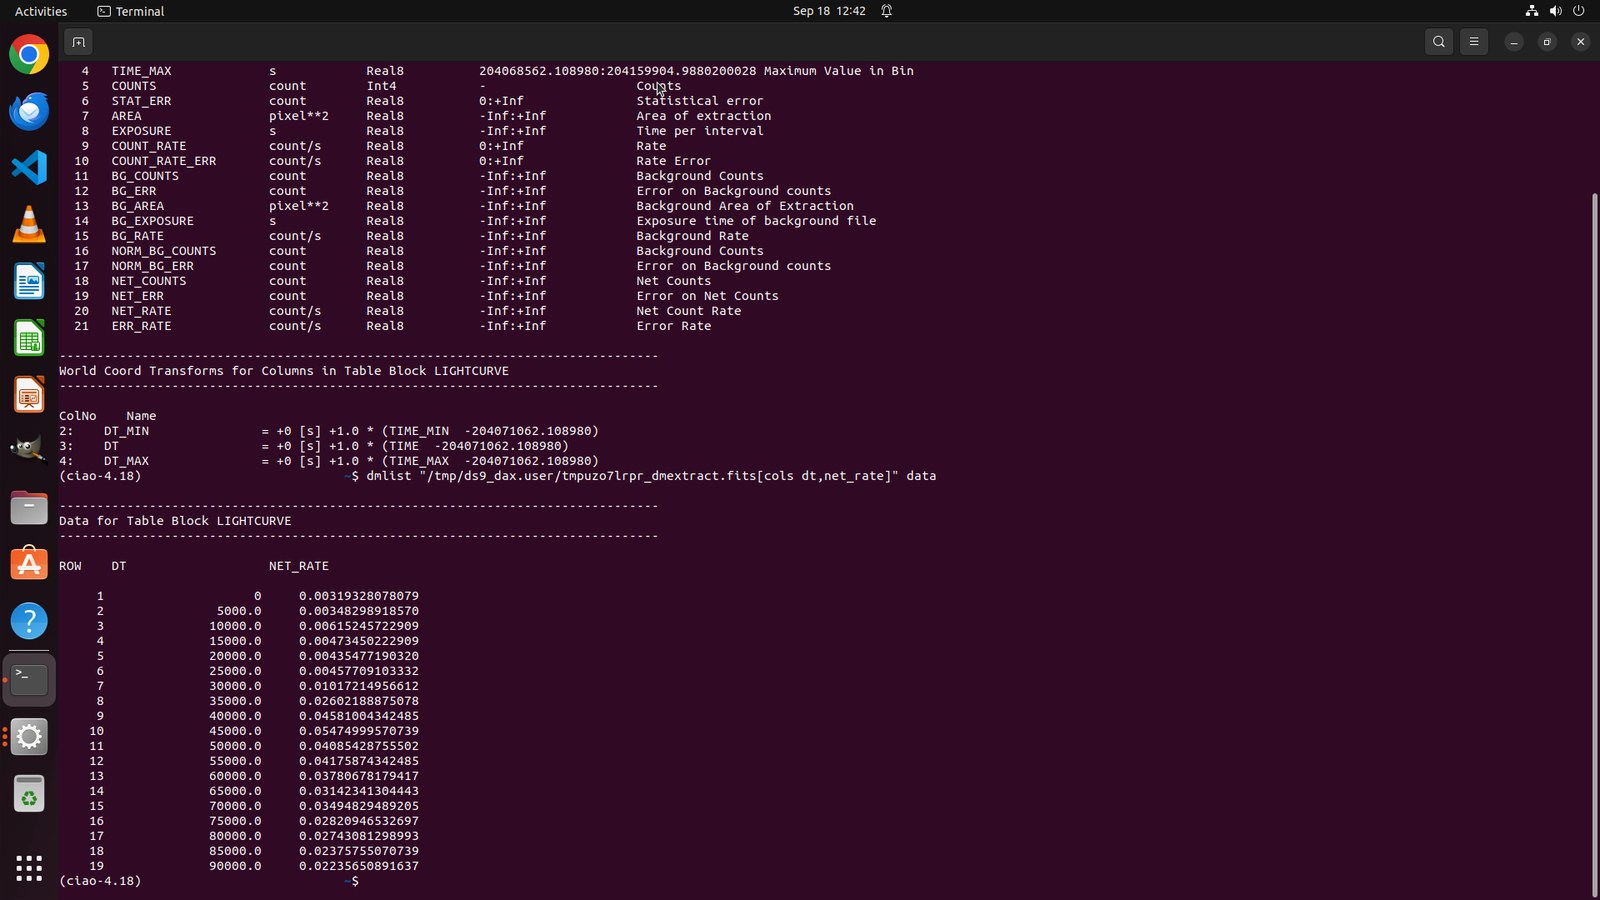
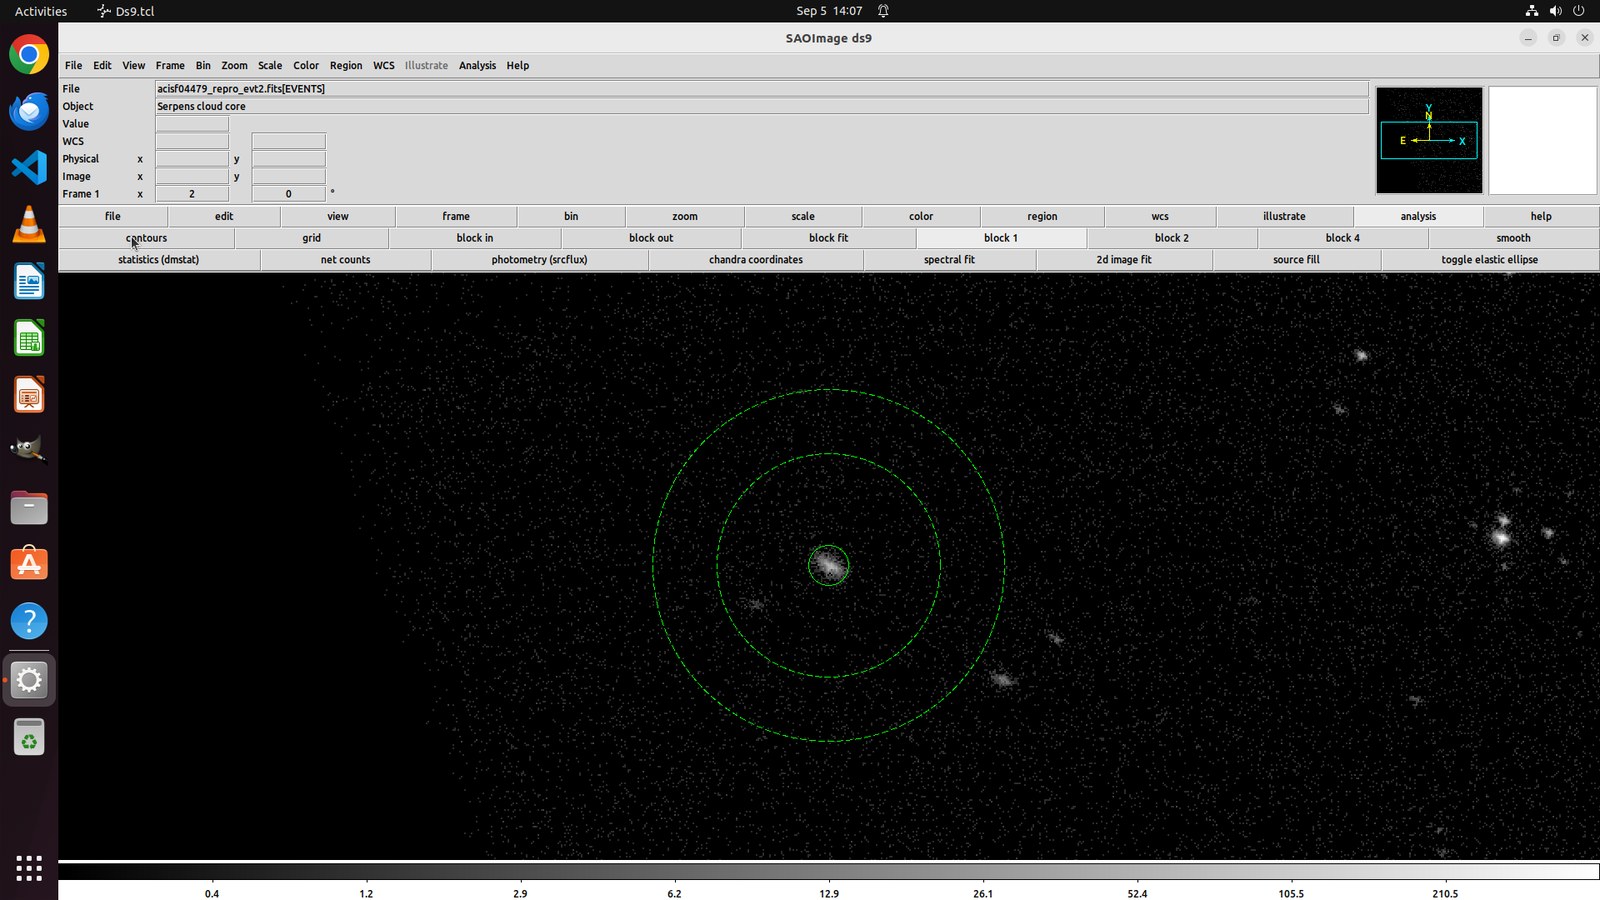
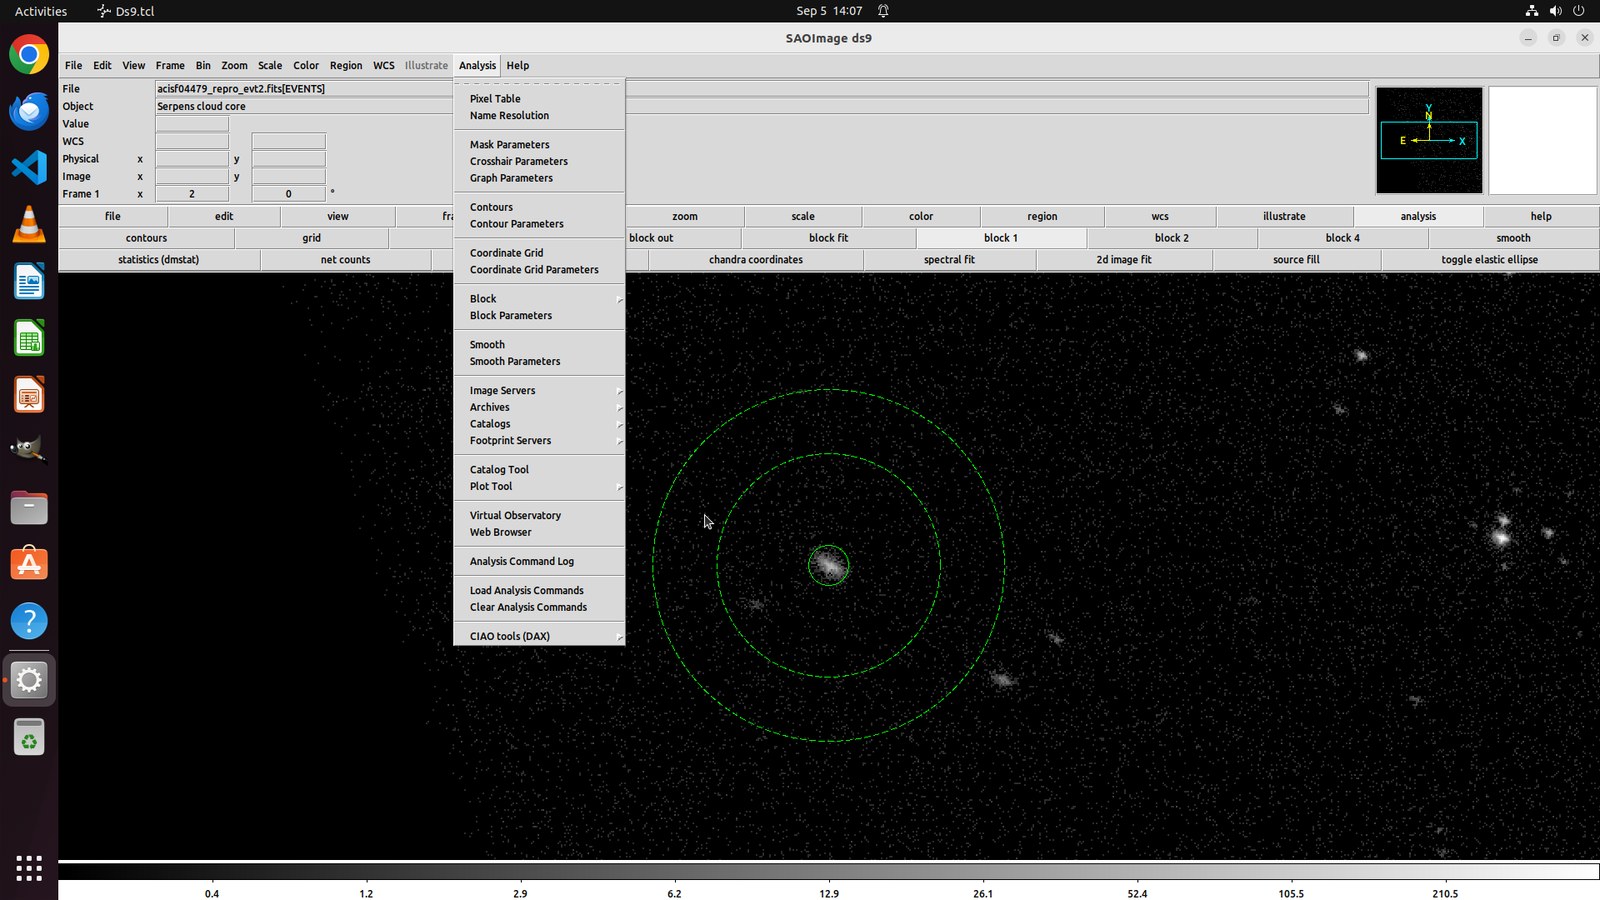
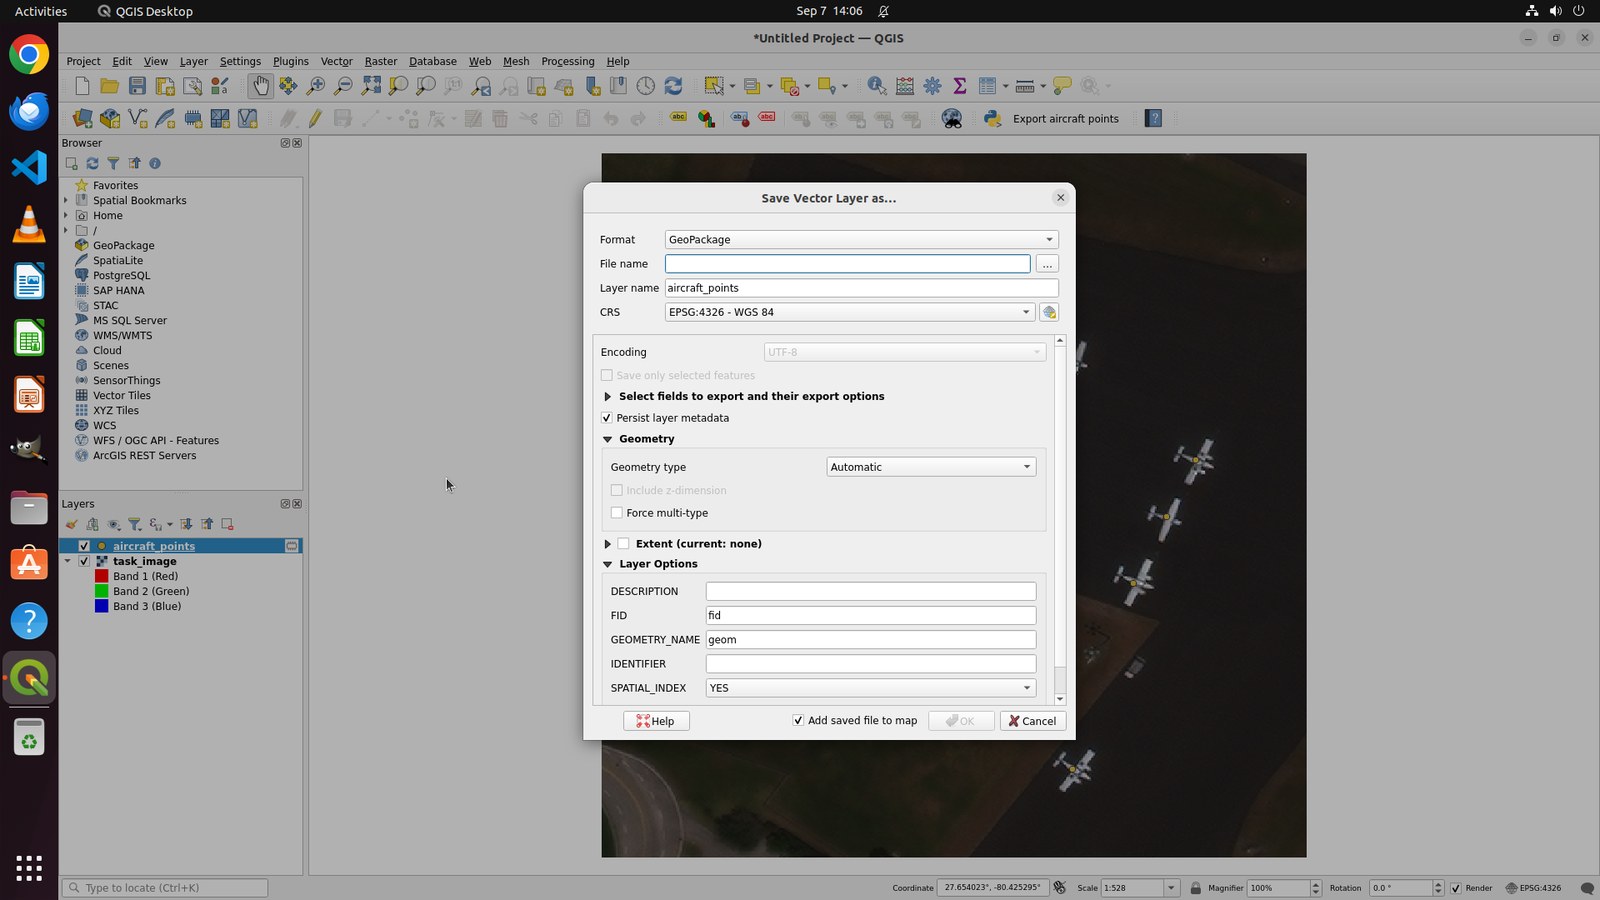
Ten tasks in five applications (QuPath, ANSYS Fluent, SAOImage DS9, Praat and QGIS), one fully credited run each, from seven models. Every frame is the agent's own screenshot; open the task showcase to step through a full run.

Citation

@misc{dai2026osworldscience,
  title  = {{OSWorld-Science}: A Benchmark of Computer Use Agents for Learning and Using Scientific Software},
  author = {Dai, Dingyuan and Qi, Heli and Liu, Lei and Li, Yinxi and Chen, Baiding and Dou, Zijun and Zeng, Qingcheng and Kang, Qi and Sun, Oliver and Wang, Eric and Zhou, Bo and Wang, Haixin and Du, Yufan and Bo, Shi and Lin, Ruihan and Yuan, Mengqi and Lu, Dunjie and Dillmann, Steven and Shi, Yiming and Su, Tina and Xin, Xin and Liu, Minghao and Wang, Xi and Huang, Xu and Zhang, Ge and Nie, Pengyu and Yang, Zhen and Tang, Jie and Li, Juanzi and Xuan, Weihao and Liu, Tianyu},
  year   = {2026},
  note   = {Preprint},
  url    = {https://github.com/larryinx/OSWorld-Science}
}